

Kuwait Corporate Fact Sheet
Kuwait Corporate Fact Sheet
Kuwait Corporate Fact Sheet

Create successful ePaper yourself
Turn your PDF publications into a flip-book with our unique Google optimized e-Paper software.
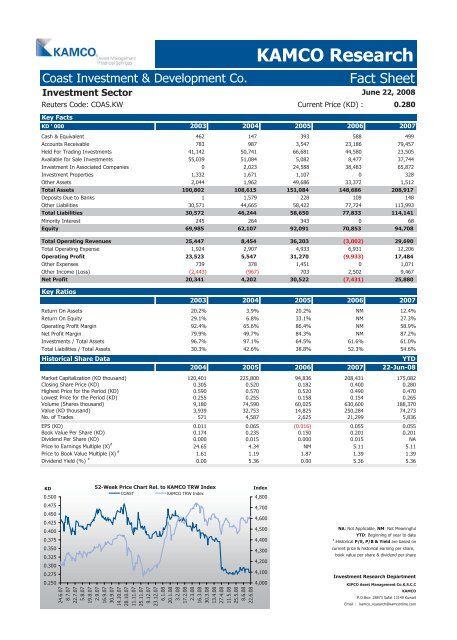
Coast Investment & Development Co. <strong>Fact</strong> <strong>Sheet</strong><br />
Investment Sector<br />
Reuters Code: COAS.KW Current Price (KD) : 0.280<br />
Key <strong>Fact</strong>s<br />
KD ' 000 2003 2004 2005 2006 2007<br />
Cash & Equivalent 462 147 393 588 499<br />
Accounts Receivable 783 987 3,547 23,186 79,457<br />
Held For Trading Investments 41,142 50,741 66,681 44,580 23,505<br />
Available for Sale Investments 55,039 51,084 5,082 8,477 37,744<br />
Investment In Associated Companies 0 2,023 24,588 38,483 65,872<br />
Investment Properties 1,332 1,671 1,107 0 328<br />
Other Assets 2,044 1,962 49,686 33,372 1,512<br />
Total Assets 100,802 108,615 151,084 148,686 208,917<br />
Deposits Due to Banks 1 1,579 228 109 148<br />
Other Liabilities 30,571 44,665 58,422 77,724 113,993<br />
Total Liabilities 30,572 46,244 58,650 77,833 114,141<br />
Minority Interest 245 264 343 0 68<br />
Equity 69,985 62,107 92,091 70,853 94,708<br />
Total Operating Revenues 25,447 8,454 36,203 (3,002) 29,690<br />
Total Operating Expense 1,924 2,907 4,933 6,931 12,206<br />
Operating Profit 23,523 5,547 31,270 (9,933) 17,484<br />
Other Expenses 739 378 1,451 0 1,071<br />
Other Income (Loss) (2,443) (967) 703 2,502 9,467<br />
Net Profit 20,341 4,202 30,522 (7,431) 25,880<br />
Key Ratios<br />
2003 2004 2005 2006 2007<br />
Return On Assets 20.2% 3.9% 20.2% NM 12.4%<br />
Return On Equity 29.1% 6.8% 33.1% NM 27.3%<br />
Operating Profit Margin 92.4% 65.6% 86.4% NM 58.9%<br />
Net Profit Margin 79.9% 49.7% 84.3% NM 87.2%<br />
Investments / Total Assets 96.7% 97.1% 64.5% 61.6% 61.0%<br />
Total Liabilities / Total Assets 30.3% 42.6% 38.8% 52.3% 54.6%<br />
Historical Share Data YTD<br />
2004 2005 2006 2007 22-Jun-08<br />
Market Capitalization (KD thousand) 120,401 225,800 94,836 208,431 175,082<br />
Closing Share Price (KD) 0.305 0.520 0.182 0.400 0.280<br />
Highest Price for the Period (KD) 0.590 0.570 0.520 0.490 0.470<br />
Lowest Price for the Period (KD) 0.255 0.255 0.158 0.154 0.265<br />
Volume (Shares thousand) 9,180 74,590 60,025 630,600 188,370<br />
Value (KD thousand) 3,939 32,753 14,825 250,284 74,273<br />
No. of Trades 571 4,587 2,625 21,299 5,836<br />
EPS (KD) 0.011 0.065 (0.016) 0.055 0.055<br />
Book Value Per Share (KD) 0.174 0.235 0.150 0.201 0.201<br />
Dividend Per Share (KD) 0.000 0.015 0.000 0.015 NA<br />
Price to Earnings Multiple (X) #<br />
24.65 4.34 NM 5.11 5.11<br />
Price to Book Value Multiple (X) #<br />
1.61 1.19 1.87 1.39 1.39<br />
Dividend Yield (%) #<br />
0.00 5.36 0.00 5.36 5.36<br />
KD<br />
0.500<br />
0.475<br />
0.450<br />
0.425<br />
0.400<br />
0.375<br />
0.350<br />
0.325<br />
0.300<br />
0.275<br />
0.250<br />
52-Week Price Chart Rel. to KAMCO TRW Index<br />
COAST KAMCO TRW Index<br />
24.6.07<br />
8.7.07<br />
22.7.07<br />
5.8.07<br />
19.8.07<br />
2.9.07<br />
16.9.07<br />
30.9.07<br />
14.10.07<br />
28.10.07<br />
11.11.07<br />
25.11.07<br />
9.12.07<br />
23.12.07<br />
6.1.08<br />
20.1.08<br />
3.2.08<br />
17.2.08<br />
2.3.08<br />
16.3.08<br />
30.3.08<br />
13.4.08<br />
27.4.08<br />
11.5.08<br />
25.5.08<br />
8.6.08<br />
22.6.08<br />
KAMCO Research<br />
Index<br />
4,800<br />
4,700<br />
4,600<br />
4,500<br />
4,400<br />
4,300<br />
4,200<br />
4,100<br />
4,000<br />
June 22, 2008<br />
NA: Not Applicable, NM: Not Meaningful<br />
YTD: Beginning of year to date<br />
#<br />
:Historical P/E, P/B & Yield are based on<br />
current price & historical earning per share,<br />
book value per share & dividend per share<br />
Investment Research Department<br />
KIPCO Asset Management Co.K.S.C.C<br />
KAMCO<br />
P.O.Box: 28873 Safat 13149 <strong>Kuwait</strong><br />
Email : kamco_research@kamconline.com


