

Kuwait Corporate Fact Sheet
Kuwait Corporate Fact Sheet
Kuwait Corporate Fact Sheet

Create successful ePaper yourself
Turn your PDF publications into a flip-book with our unique Google optimized e-Paper software.
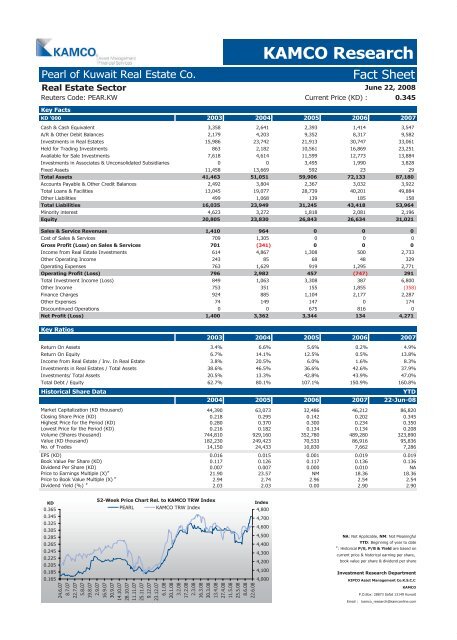
Pearl of <strong>Kuwait</strong> Real Estate Co. <strong>Fact</strong> <strong>Sheet</strong><br />
Real Estate Sector<br />
Reuters Code: PEAR.KW Current Price (KD) : 0.345<br />
Key <strong>Fact</strong>s<br />
KD '000 2003 2004 2005 2006 2007<br />
Cash & Cash Equivalent 3,358 2,641 2,393 1,414 3,547<br />
A/R & Other Debit Balances 2,179 4,203 9,352 8,317 9,582<br />
Investments in Real Estates 15,986 23,742 21,913 30,747 33,061<br />
Held for Trading Investments 863 2,182 10,561 16,869 23,251<br />
Available for Sale Investments 7,618 4,614 11,599 12,773 13,884<br />
Investments in Associates & Unconsolidated Subsidiaries 0 0 3,495 1,990 3,828<br />
Fixed Assets 11,458 13,669 592 23 29<br />
Total Assets 41,463 51,051 59,906 72,133 87,180<br />
Accounts Payable & Other Credit Balances 2,492 3,804 2,367 3,032 3,922<br />
Total Loans & Facilities 13,045 19,077 28,739 40,201 49,884<br />
Other Liabilities 499 1,068 139 185 158<br />
Total Liabilities 16,035 23,949 31,245 43,418 53,964<br />
Minority interest 4,623 3,272 1,818 2,081 2,196<br />
Equity 20,805 23,830 26,843 26,634 31,021<br />
Sales & Service Revenues 1,410 964 0 0 0<br />
Cost of Sales & Services 709 1,305 0 0 0<br />
Gross Profit (Loss) on Sales & Services 701 (341) 0 0 0<br />
Income from Real Estate Investments 614 4,867 1,308 500 2,733<br />
Other Operating Income 243 85 68 48 329<br />
Operating Expenses 763 1,629 919 1,295 2,771<br />
Operating Profit (Loss) 796 2,982 457 (747) 291<br />
Total Investment Income (Loss) 849 1,063 3,308 387 6,800<br />
Other Income 753 351 155 1,855 (358)<br />
Finance Charges 924 885 1,104 2,177 2,287<br />
Other Expenses 74 149 147 0 174<br />
Discountinued Operations 0 0 675 816 0<br />
Net Profit (Loss) 1,400 3,362 3,344 134 4,271<br />
Key Ratios<br />
KAMCO Research<br />
June 22, 2008<br />
2003 2004 2005 2006 2007<br />
Return On Assets 3.4% 6.6% 5.6% 0.2% 4.9%<br />
Return On Equity 6.7% 14.1% 12.5% 0.5% 13.8%<br />
Income from Real Estate / Inv. In Real Estate 3.8% 20.5% 6.0% 1.6% 8.3%<br />
Investments in Real Estates / Total Assets 38.6% 46.5% 36.6% 42.6% 37.9%<br />
Investments/ Total Assets 20.5% 13.3% 42.8% 43.9% 47.0%<br />
Total Debt / Equity 62.7% 80.1% 107.1% 150.9% 160.8%<br />
Historical Share Data YTD<br />
2004 2005 2006 2007 22-Jun-08<br />
Market Capitalization (KD thousand) 44,390 63,073 32,486 46,212 86,820<br />
Closing Share Price (KD) 0.218 0.295 0.142 0.202 0.345<br />
Highest Price for the Period (KD) 0.280 0.370 0.300 0.234 0.350<br />
Lowest Price for the Period (KD) 0.216 0.182 0.134 0.134 0.208<br />
Volume (Shares thousand) 744,810 929,160 352,780 489,280 323,890<br />
Value (KD thousand) 182,230 249,423 70,533 86,916 95,836<br />
No. of Trades 14,150 24,433 10,830 7,662 7,286<br />
EPS (KD) 0.016 0.015 0.001 0.019 0.019<br />
Book Value Per Share (KD) 0.117 0.126 0.117 0.136 0.136<br />
Dividend Per Share (KD) 0.007 0.007 0.000 0.010 NA<br />
Price to Earnings Multiple (X) #<br />
21.90 23.57 NM 18.36 18.36<br />
Price to Book Value Multiple (X) #<br />
2.94 2.74 2.96 2.54 2.54<br />
Dividend Yield (%) #<br />
2.03 2.03 0.00 2.90 2.90<br />
KD<br />
0.365<br />
0.345<br />
0.325<br />
0.305<br />
0.285<br />
0.265<br />
0.245<br />
0.225<br />
0.205<br />
0.185<br />
0.165<br />
52-Week Price Chart Rel. to KAMCO TRW Index<br />
Index<br />
24.6.07<br />
8.7.07<br />
22.7.07<br />
5.8.07<br />
19.8.07<br />
2.9.07<br />
16.9.07<br />
30.9.07<br />
14.10.07<br />
28.10.07<br />
11.11.07<br />
25.11.07<br />
9.12.07<br />
23.12.07<br />
6.1.08<br />
20.1.08<br />
3.2.08<br />
17.2.08<br />
2.3.08<br />
16.3.08<br />
30.3.08<br />
13.4.08<br />
27.4.08<br />
11.5.08<br />
25.5.08<br />
8.6.08<br />
22.6.08<br />
PEARL KAMCO TRW Index<br />
4,800<br />
4,700<br />
4,600<br />
4,500<br />
4,400<br />
4,300<br />
4,200<br />
4,100<br />
4,000<br />
NA: Not Applicable, NM: Not Meaningful<br />
YTD: Beginning of year to date<br />
#<br />
: Historical P/E, P/B & Yield are based on<br />
current price & historical earning per share,<br />
book value per share & dividend per share<br />
Investment Research Department<br />
KIPCO Asset Management Co.K.S.C.C<br />
KAMCO<br />
P.O.Box: 28873 Safat 13149 <strong>Kuwait</strong><br />
Email : kamco_research@kamconline.com


