

Kuwait Corporate Fact Sheet
Kuwait Corporate Fact Sheet
Kuwait Corporate Fact Sheet

Create successful ePaper yourself
Turn your PDF publications into a flip-book with our unique Google optimized e-Paper software.
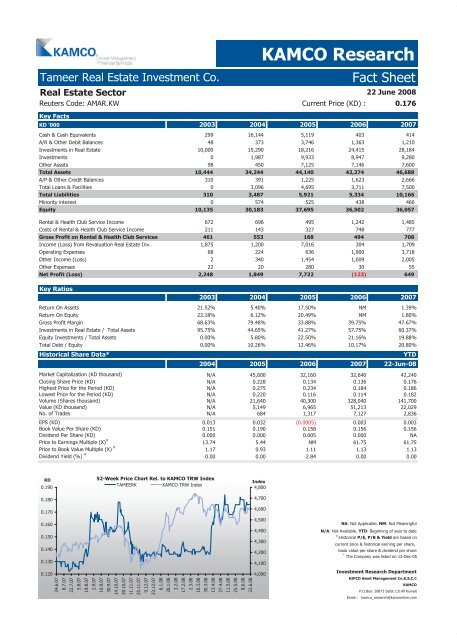
Tameer Real Estate Investment Co. <strong>Fact</strong> <strong>Sheet</strong><br />
Real Estate Sector<br />
Reuters Code: AMAR.KW Current Price (KD) : 0.176<br />
Key <strong>Fact</strong>s<br />
KD '000 2003 2004 2005 2006 2007<br />
Cash & Cash Equivalents 299 16,144 5,119 403 414<br />
A/R & Other Debit Balances 48 373 3,746 1,363 1,210<br />
Investments in Real Estate 10,000 15,290 18,216 24,415 28,184<br />
Investments 0 1,987 9,933 8,947 9,280<br />
Other Assets 98 450 7,125 7,146 7,600<br />
Total Assets 10,444 34,244 44,140 42,274 46,688<br />
A/P & Other Credit Balances 310 391 1,225 1,623 2,666<br />
Total Loans & Facilities 0 3,096 4,695 3,711 7,500<br />
Total Liabilities 310 3,487 5,921 5,334 10,166<br />
Minority interest 0 574 525 438 466<br />
Equity 10,135 30,183 37,695 36,502 36,057<br />
Rental & Health Club Service Income 672 696 495 1,242 1,485<br />
Costs of Rental & Health Club Service Income 211 143 327 748 777<br />
Gross Profit on Rental & Health Club Services 461 553 168 494 708<br />
Income (Loss) from Revaluation Real Estate Inv. 1,875 1,200 7,016 304 1,709<br />
Operating Expenses 68 224 636 1,900 3,718<br />
Other Income (Loss) 2 340 1,454 1,009 2,005<br />
Other Expenses 22 20 280 30 55<br />
Net Profit (Loss) 2,248 1,849 7,722 (123) 649<br />
Key Ratios<br />
2003 2004 2005 2006 2007<br />
Return On Assets 21.52% 5.40% 17.50% NM 1.39%<br />
Return On Equity 22.18% 6.12% 20.49% NM 1.80%<br />
Gross Profit Margin 68.63% 79.48% 33.88% 39.75% 47.67%<br />
Investments in Real Estate / Total Assets 95.75% 44.65% 41.27% 57.75% 60.37%<br />
Equity Investments / Total Assets 0.00% 5.80% 22.50% 21.16% 19.88%<br />
Total Debt / Equity 0.00% 10.26% 12.46% 10.17% 20.80%<br />
Historical Share Data* YTD<br />
2004 2005 2006 2007 22-Jun-08<br />
Market Capitalization (KD thousand) N/A 45,600 32,160 32,640 42,240<br />
Closing Share Price (KD) N/A 0.228 0.134 0.136 0.176<br />
Highest Price for the Period (KD) N/A 0.275 0.234 0.184 0.186<br />
Lowest Price for the Period (KD) N/A 0.220 0.116 0.114 0.182<br />
Volume (Shares thousand) N/A 21,640 40,300 328,040 141,700<br />
Value (KD thousand) N/A 5,149 6,965 51,213 22,029<br />
No. of Trades N/A 684 1,317 7,127 2,836<br />
EPS (KD) 0.013 0.032 (0.0005) 0.003 0.003<br />
Book Value Per Share (KD) 0.151 0.190 0.158 0.156 0.156<br />
Dividend Per Share (KD) 0.000 0.000 0.005 0.000 NA<br />
Price to Earnings Multiple (X) #<br />
13.74 5.44 NM 61.75 61.75<br />
Price to Book Value Multiple (X) #<br />
1.17 0.93 1.11 1.13 1.13<br />
Dividend Yield (%) #<br />
0.00 0.00 2.84 0.00 0.00<br />
KD<br />
0.190<br />
0.180<br />
0.170<br />
0.160<br />
0.150<br />
0.140<br />
0.130<br />
0.120<br />
52-Week Price Chart Rel. to KAMCO TRW Index<br />
TAMEERK KAMCO TRW Index<br />
Index<br />
24.6.07<br />
8.7.07<br />
22.7.07<br />
5.8.07<br />
19.8.07<br />
2.9.07<br />
16.9.07<br />
30.9.07<br />
14.10.07<br />
28.10.07<br />
11.11.07<br />
25.11.07<br />
9.12.07<br />
23.12.07<br />
6.1.08<br />
20.1.08<br />
3.2.08<br />
17.2.08<br />
2.3.08<br />
16.3.08<br />
30.3.08<br />
13.4.08<br />
27.4.08<br />
11.5.08<br />
25.5.08<br />
8.6.08<br />
22.6.08<br />
270,268,000<br />
4,800<br />
4,700<br />
4,600<br />
4,500<br />
4,400<br />
4,300<br />
4,200<br />
4,100<br />
270,268,000<br />
4,000<br />
KAMCO Research<br />
22 June 2008<br />
NA: Not Applicable, NM: Not Meaningful<br />
N/A: Not Available. YTD: Beginning of year to date<br />
#<br />
:Historical P/E, P/B & Yield are based on<br />
current price & historical earning per share,<br />
book value per share & dividend per share<br />
*<br />
The Company was listed on 12-Dec-05<br />
Investment Research Department<br />
KIPCO Asset Management Co.K.S.C.C<br />
KAMCO<br />
P.O.Box: 28873 Safat 13149 <strong>Kuwait</strong><br />
Email : kamco_research@kamconline.com


