

Kuwait Corporate Fact Sheet
Kuwait Corporate Fact Sheet
Kuwait Corporate Fact Sheet

Create successful ePaper yourself
Turn your PDF publications into a flip-book with our unique Google optimized e-Paper software.
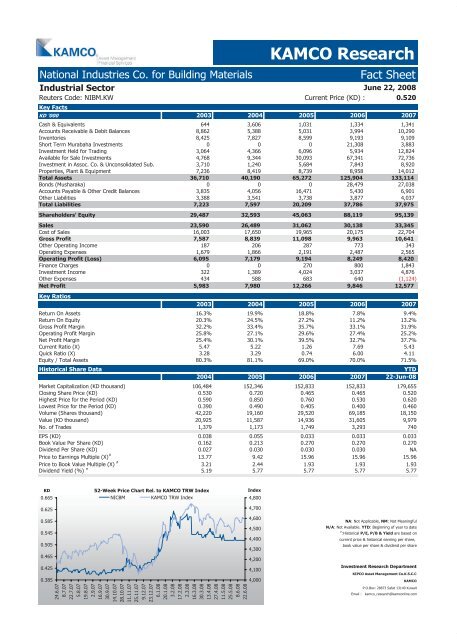
National Industries Co. for Building Materials <strong>Fact</strong> <strong>Sheet</strong><br />
Industrial Sector<br />
June 22, 2008<br />
Reuters Code: NIBM.KW Current Price (KD) : 0.520<br />
Key <strong>Fact</strong>s<br />
KAMCO Research<br />
KD '000 2003 2004 2005 2006 2007<br />
Cash & Equivalents 644 3,606 1,031 1,334 1,341<br />
Accounts Receivable & Debit Balances 8,862 5,388 5,031 3,994 10,290<br />
Inventories 8,425 7,827 8,599 9,193 9,109<br />
Short Term Murabaha Investments 0 0 0 21,308 3,883<br />
Investment Held for Trading 3,064 4,366 6,096 5,934 12,824<br />
Available for Sale Investments 4,768 9,344 30,093 67,341 72,736<br />
Investment in Assoc. Co. & Unconsolidated Sub. 3,710 1,240 5,684 7,843 8,920<br />
Properties, Plant & Equipment 7,236 8,419 8,739 8,958 14,012<br />
Total Assets 36,710 40,190 65,272 125,904 133,114<br />
Bonds (Musharaka) 0 0 0 28,479 27,038<br />
Accounts Payable & Other Credit Balances 3,835 4,056 16,471 5,430 6,901<br />
Other Liabilities 3,388 3,541 3,738 3,877 4,037<br />
Total Liabilities 7,223 7,597 20,209 37,786 37,975<br />
Shareholders' Equity 29,487 32,593 45,063 88,119 95,139<br />
Sales 23,590 26,489 31,062 30,138 33,345<br />
Cost of Sales 16,003 17,650 19,965 20,175 22,704<br />
Gross Profit 7,587 8,839 11,098 9,963 10,641<br />
Other Operating Income 187 206 287 773 343<br />
Operating Expenses 1,679 1,866 2,191 2,487 2,565<br />
Operating Profit (Loss) 6,095 7,179 9,194 8,249 8,420<br />
Finance Charges 0 0 270 800 1,843<br />
Investment Income 322 1,389 4,024 3,037 4,876<br />
Other Expenses 434 588 683 640 (1,124)<br />
Net Profit 5,983 7,980 12,266 9,846 12,577<br />
Key Ratios<br />
2003 2004 2005 2006 2007<br />
Return On Assets 16.3% 19.9% 18.8% 7.8% 9.4%<br />
Return On Equity 20.3% 24.5% 27.2% 11.2% 13.2%<br />
Gross Profit Margin 32.2% 33.4% 35.7% 33.1% 31.9%<br />
Operating Profit Margin 25.8% 27.1% 29.6% 27.4% 25.2%<br />
Net Profit Margin 25.4% 30.1% 39.5% 32.7% 37.7%<br />
Current Ratio (X) 5.47<br />
5.22<br />
1.26<br />
7.69<br />
5.43<br />
Quick Ratio (X) 3.28<br />
3.29<br />
0.74<br />
6.00<br />
4.11<br />
Equity / Total Assets 80.3% 81.1% 69.0% 70.0% 71.5%<br />
Historical Share Data YTD<br />
2004 2005 2006 2007 22-Jun-08<br />
Market Capitalization (KD thousand) 106,484 152,346 152,833 152,833 179,655<br />
Closing Share Price (KD) 0.530 0.720 0.465 0.465 0.520<br />
Highest Price for the Period (KD) 0.590 0.850 0.760 0.530 0.620<br />
Lowest Price for the Period (KD) 0.390 0.490 0.405 0.400 0.460<br />
Volume (Shares thousand) 42,220 19,160 29,520 69,185 18,150<br />
Value (KD thousand) 20,925 11,587 14,936 31,605 9,979<br />
No. of Trades 1,379 1,173 1,749 3,293 740<br />
EPS (KD) 0.038 0.055 0.033 0.033 0.033<br />
Book Value Per Share (KD) 0.162 0.213 0.270 0.270 0.270<br />
Dividend Per Share (KD) 0.027 0.030 0.030 0.030 NA<br />
Price to Earnings Multiple (X) #<br />
13.77 9.42 15.96 15.96 15.96<br />
Price to Book Value Multiple (X) #<br />
3.21 2.44 1.93 1.93 1.93<br />
Dividend Yield (%) #<br />
5.19 5.77 5.77 5.77 5.77<br />
KD<br />
0.665<br />
0.625<br />
0.585<br />
0.545<br />
0.505<br />
0.465<br />
0.425<br />
0.385<br />
52-Week Price Chart Rel. to KAMCO TRW Index<br />
NICBM KAMCO TRW Index<br />
24.6.07<br />
8.7.07<br />
22.7.07<br />
5.8.07<br />
19.8.07<br />
2.9.07<br />
16.9.07<br />
30.9.07<br />
14.10.07<br />
28.10.07<br />
11.11.07<br />
25.11.07<br />
9.12.07<br />
23.12.07<br />
6.1.08<br />
20.1.08<br />
3.2.08<br />
17.2.08<br />
2.3.08<br />
16.3.08<br />
30.3.08<br />
13.4.08<br />
27.4.08<br />
11.5.08<br />
25.5.08<br />
8.6.08<br />
22.6.08<br />
Index<br />
4,800<br />
4,700<br />
4,600<br />
4,500<br />
4,400<br />
4,300<br />
4,200<br />
4,100<br />
4,000<br />
NA: Not Applicable, NM: Not Meaningful<br />
N/A: Not Available. YTD: Beginning of year to date<br />
#<br />
:Historical P/E, P/B & Yield are based on<br />
current price & historical earning per share,<br />
book value per share & dividend per share<br />
Investment Research Department<br />
KIPCO Asset Management Co.K.S.C.C<br />
KAMCO<br />
P.O.Box: 28873 Safat 13149 <strong>Kuwait</strong><br />
Email : kamco_research@kamconline.com


