

Kuwait Corporate Fact Sheet
Kuwait Corporate Fact Sheet
Kuwait Corporate Fact Sheet

You also want an ePaper? Increase the reach of your titles
YUMPU automatically turns print PDFs into web optimized ePapers that Google loves.
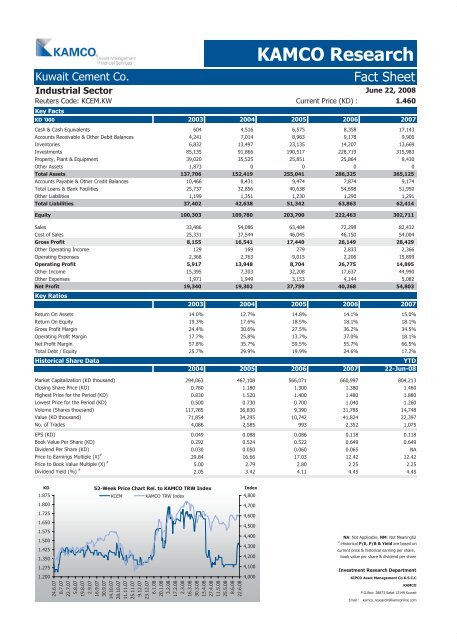
<strong>Kuwait</strong> Cement Co. <strong>Fact</strong> <strong>Sheet</strong><br />
Industrial Sector<br />
Reuters Code: KCEM.KW Current Price (KD) : 1.460<br />
Key <strong>Fact</strong>s<br />
KAMCO Research<br />
June 22, 2008<br />
KD '000 2003 2004 2005 2006 2007<br />
Cash & Cash Equivalents 604<br />
4,516<br />
6,575<br />
8,358<br />
17,143<br />
Accounts Receivable & Other Debit Balances 4,241<br />
7,014<br />
8,963<br />
9,178<br />
9,900<br />
Inventories 6,832<br />
13,497<br />
23,135<br />
14,207<br />
13,669<br />
Investments 85,135<br />
91,866<br />
190,517<br />
228,719<br />
315,983<br />
Property, Plant & Equipment 39,020<br />
35,525<br />
25,851<br />
25,864<br />
8,430<br />
Other Assets 1,873 0 0 0 0<br />
Total Assets 137,706 152,419 255,041 286,325 365,125<br />
Accounts Payable & Other Credit Balances 10,466<br />
8,431<br />
9,474<br />
7,874<br />
9,174<br />
Total Loans & Bank Facilities 25,737<br />
32,856<br />
40,638<br />
54,698<br />
51,950<br />
Other Liabilities 1,199<br />
1,351<br />
1,230<br />
1,290<br />
1,291<br />
Total Liabilities 37,402 42,638 51,342 63,863 62,414<br />
Equity 100,303 109,780 203,700 222,463 302,711<br />
Sales 33,486<br />
54,086<br />
63,484<br />
72,298<br />
82,432<br />
Cost of Sales 25,331 37,544 46,045 46,150 54,004<br />
Gross Profit 8,155 16,541 17,440 26,149 28,429<br />
Other Operating Income 129 169 279 2,833 2,366<br />
Operating Expenses 2,368 2,763 9,015 2,206 15,899<br />
Operating Profit 5,917 13,948 8,704 26,775 14,895<br />
Other Income 15,395 7,303 32,208 17,637 44,990<br />
Other Expenses 1,971 1,949 3,153 4,144 5,082<br />
Net Profit<br />
Key Ratios<br />
19,340 19,302 37,759 40,268 54,803<br />
2003 2004 2005 2006 2007<br />
Return On Assets 14.0% 12.7% 14.8% 14.1% 15.0%<br />
Return On Equity 19.3% 17.6% 18.5% 18.1% 18.1%<br />
Gross Profit Margin 24.4% 30.6% 27.5% 36.2% 34.5%<br />
Operating Profit Margin 17.7% 25.8% 13.7% 37.0% 18.1%<br />
Net Profit Margin 57.8% 35.7% 59.5% 55.7% 66.5%<br />
Total Debt / Equity 25.7% 29.9% 19.9% 24.6% 17.2%<br />
Historical Share Data YTD<br />
2004 2005 2006 2007 22-Jun-08<br />
Market Capitalization (KD thousand) 294,063 467,108 566,071 660,997 804,213<br />
Closing Share Price (KD) 0.780 1.180 1.300 1.380 1.460<br />
Highest Price for the Period (KD) 0.830 1.520 1.400 1.480 1.880<br />
Lowest Price for the Period (KD) 0.500 0.730 0.700 1.040 1.260<br />
Volume (Shares thousand) 117,785 36,830 9,390 31,785 14,748<br />
Value (KD thousand) 71,854 34,295 10,742 41,824 22,397<br />
No. of Trades 4,086 2,585 993 2,352 1,075<br />
EPS (KD) 0.049 0.088 0.086 0.118 0.118<br />
Book Value Per Share (KD) 0.292 0.524 0.522 0.649 0.649<br />
Dividend Per Share (KD) 0.030 0.050 0.060 0.065 NA<br />
Price to Earnings Multiple (X) #<br />
29.84 16.66 17.03 12.42 12.42<br />
Price to Book Value Multiple (X) #<br />
5.00 2.79 2.80 2.25 2.25<br />
Dividend Yield (%) #<br />
2.05 3.42 4.11 4.45 4.45<br />
KD<br />
1.875<br />
1.800<br />
1.725<br />
1.650<br />
1.575<br />
1.500<br />
1.425<br />
1.350<br />
1.275<br />
1.200<br />
52-Week Price Chart Rel. to KAMCO TRW Index<br />
KCEM KAMCO TRW Index<br />
24.6.07<br />
8.7.07<br />
22.7.07<br />
5.8.07<br />
19.8.07<br />
2.9.07<br />
16.9.07<br />
30.9.07<br />
14.10.07<br />
28.10.07<br />
11.11.07<br />
25.11.07<br />
9.12.07<br />
23.12.07<br />
6.1.08<br />
20.1.08<br />
3.2.08<br />
17.2.08<br />
2.3.08<br />
16.3.08<br />
30.3.08<br />
13.4.08<br />
27.4.08<br />
11.5.08<br />
25.5.08<br />
8.6.08<br />
22.6.08<br />
Index<br />
4,800<br />
4,700<br />
4,600<br />
4,500<br />
4,400<br />
4,300<br />
4,200<br />
4,100<br />
4,000<br />
NA: Not Applicable, NM: Not Meaningful<br />
#<br />
:Historical P/E, P/B & Yield are based on<br />
current price & historical earning per share,<br />
book value per share & dividend per share<br />
Investment Research Department<br />
KIPCO Asset Management Co.K.S.C.C<br />
KAMCO<br />
P.O.Box: 28873 Safat 13149 <strong>Kuwait</strong><br />
Email : kamco_research@kamconline.com


