

Kuwait Corporate Fact Sheet
Kuwait Corporate Fact Sheet
Kuwait Corporate Fact Sheet

Create successful ePaper yourself
Turn your PDF publications into a flip-book with our unique Google optimized e-Paper software.
Hayat Communication Co. <strong>Fact</strong> <strong>Sheet</strong><br />
Services Sector<br />
KAMCO Research<br />
Reuters Code: HAYK.KW Current Price (KD) :<br />
June 22, 2008<br />
0.405<br />
Key <strong>Fact</strong>s<br />
KD '000 2003 2004 2005 2006 2007<br />
Cash & Cash Equivalent 176 305 838 1,295 1,011<br />
Account Receivables & Other Debit Balances 1,162 2,096 3,655 5,002 8,419<br />
Inventories 230 218 559 1,726 1,858<br />
Investments 0 0 1,739 1,772 45<br />
Property & Equipment 19 71 445 617 754<br />
Other Assets 60 179 189 1,228 2,927<br />
Total Assets 1,647 2,869 7,424 11,639 15,014<br />
Due to Banks 208 255 463 31 163<br />
Accounts Payable & Other Credit Balances 555 757 1,096 2,828 5,631<br />
Loans 2 0 0 0 817<br />
Other Liabilities 49 75 125 201 307<br />
Total Liabilities 814 1,088 1,684 3,060 6,918<br />
Equity 832 1,781 5,740 8,579 8,096<br />
Sales 3,245 6,228 8,423 13,853 13,500<br />
Cost of Sales 2,360 4,630 5,270 9,855 10,861<br />
Gross Profit 886 1,598 3,152 3,998 2,640<br />
Operating Income 80 385 794 271 242<br />
Operating Expenses 270 563 826 1,482 2,172<br />
Operating Profit 695 1,420 3,121 2,786 710<br />
Other Income 0 0 0 0 0<br />
Other Expenses 0 0 66 37 25<br />
Net Profit<br />
Key Ratios<br />
695 1,420 3,055 2,749 685<br />
2003 2004 2005 2006 2007<br />
Return On Assets 42.2% 49.5% 41.1% 23.6% 4.6%<br />
Return On Equity 83.5% 79.7% 53.2% 32.0% 8.5%<br />
Gross Profit Margin 27.3% 25.7% 37.4% 28.9% 19.6%<br />
Operating Profit Margin 21.4% 22.8% 37.1% 20.1% 5.3%<br />
Net Profit Margin 21.4% 22.8% 36.3% 19.8% 5.1%<br />
Total Liabilities / Total Assets 49.4% 37.9% 22.7% 26.3% 46.1%<br />
Historical Share Data YTD<br />
2004 2005 2006 2007 22-Jun-08<br />
Market Capitalization (KD thousand) N/A N/A N/A 24,900 24,300<br />
Closing Share Price (KD) N/A N/A N/A 0.415 0.405<br />
Highest Price For the Period (KD) N/A N/A N/A 0.495 0.425<br />
Lowest Price For the Period (KD) N/A N/A N/A 0.305 0.360<br />
Volume (Shares thousand) N/A N/A N/A 88,665 17,650<br />
Value (KD thousand) N/A N/A N/A 36,417 7,098<br />
No. of Trades N/A N/A N/A 3,052 758<br />
EPS (KD) 0.142 0.102 0.092 0.011 0.011<br />
Book Value Per Share (KD) 0.178 0.191 0.286 0.135 0.135<br />
Dividend Per Share (KD) 0.000 0.000 0.030 0.010 NA<br />
Price to Earnings Multiple (X) 2.85 3.98 4.42 35.46 35.46<br />
Price to Book Value Multiple (X) 2.27 2.12 1.42 3.00 3.00<br />
Dividend Yield (%) 0.00 0.00 7.41 2.47 2.47<br />
KD<br />
0.490<br />
0.470<br />
0.450<br />
0.430<br />
0.410<br />
0.390<br />
0.370<br />
0.350<br />
0.330<br />
0.310<br />
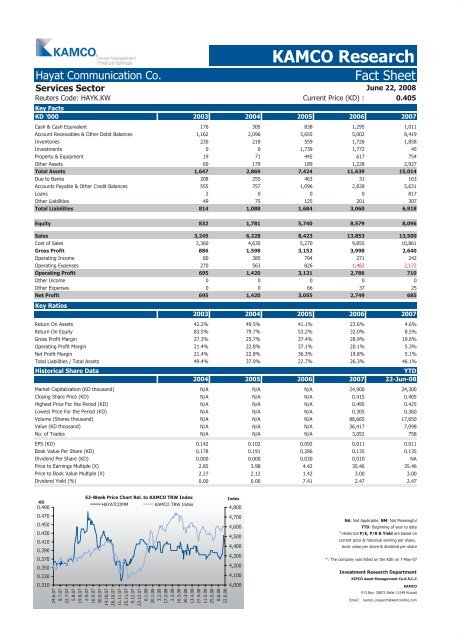
52-Week Price Chart Rel. to KAMCO TRW Index<br />
HAYATCOMM KAMCO TRW Index<br />
24.6.07<br />
8.7.07<br />
22.7.07<br />
5.8.07<br />
19.8.07<br />
2.9.07<br />
16.9.07<br />
30.9.07<br />
14.10.07<br />
28.10.07<br />
11.11.07<br />
25.11.07<br />
9.12.07<br />
23.12.07<br />
6.1.08<br />
20.1.08<br />
3.2.08<br />
17.2.08<br />
2.3.08<br />
16.3.08<br />
30.3.08<br />
13.4.08<br />
27.4.08<br />
11.5.08<br />
25.5.08<br />
8.6.08<br />
22.6.08<br />
Index<br />
4,800<br />
4,700<br />
4,600<br />
4,500<br />
4,400<br />
4,300<br />
4,200<br />
4,100<br />
4,000<br />
NA: Not Applicable, NM: Not Meaningful<br />
YTD: Beginning of year to date<br />
#<br />
:Historical P/E, P/B & Yield are based on<br />
current price & historical earning per share,<br />
book value per share & dividend per share<br />
*: The company was listed on the KSE on 7-May-07<br />
Investment Research Department<br />
KIPCO Asset Management Co.K.S.C.C<br />
KAMCO<br />
P.O.Box: 28873 Safat 13149 <strong>Kuwait</strong><br />
Email : kamco_research@kamconline.com


