

Kuwait Corporate Fact Sheet
Kuwait Corporate Fact Sheet
Kuwait Corporate Fact Sheet

Create successful ePaper yourself
Turn your PDF publications into a flip-book with our unique Google optimized e-Paper software.
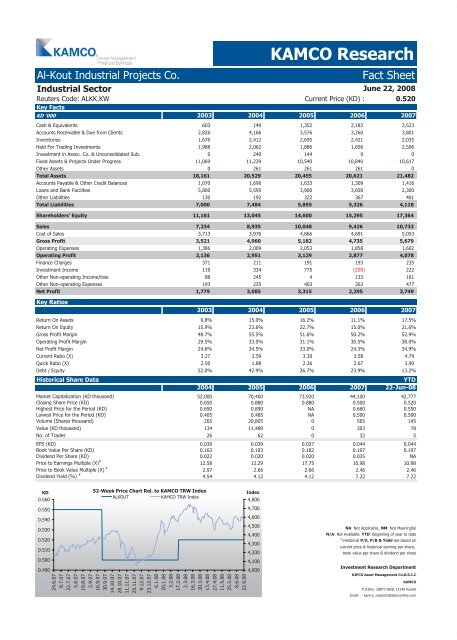
Al-Kout Industrial Projects Co. <strong>Fact</strong> <strong>Sheet</strong><br />
Industrial Sector<br />
June 22, 2008<br />
Reuters Code: ALKK.KW<br />
Key <strong>Fact</strong>s<br />
Current Price (KD) : 0.520<br />
KD '000 2003 2004 2005 2006 2007<br />
Cash & Equivalents 603 149 1,352 2,183 2,523<br />
Accounts Receivable & Due from Clients 2,826 4,166 3,576 3,260 3,801<br />
Inventories 1,676 2,412 2,695 2,421 2,035<br />
Held For Trading Investments 1,988 2,062 1,886 1,656 2,506<br />
Investment in Assoc. Co. & Unconsolidated Sub. 0 240 144 0 0<br />
Fixed Assets & Projects Under Progress 11,069 11,239 10,540 10,840 10,617<br />
Other Assets 0 261 261 261 0<br />
Total Assets 18,161 20,529 20,455 20,621 21,482<br />
Accounts Payable & Other Credit Balances 1,070 1,696 1,633 1,309 1,416<br />
Loans and Bank Facilities 5,800 5,595 3,900 3,650 2,300<br />
Other Liabilities 130 192 322 367 401<br />
Total Liabilities 7,000 7,484 5,855 5,326 4,118<br />
Shareholders' Equity 11,161 13,045 14,600 15,295 17,364<br />
Sales 7,234 8,935 10,048 9,426 10,733<br />
Cost of Sales 3,713 3,976 4,866 4,691 5,053<br />
Gross Profit 3,521 4,960 5,182 4,735 5,679<br />
Operating Expenses 1,386 2,009 2,053 1,858 1,602<br />
Operating Profit 2,136 2,951 3,129 2,877 4,078<br />
Finance Charges 371 211 191 193 235<br />
Investment Income 119 334 775 (259) 222<br />
Other Non-operating Income/loss 88 245 4 133 161<br />
Other Non-operating Expenses 193 235 403 263 477<br />
Net Profit 1,779 3,085 3,315 2,295 3,749<br />
Key Ratios<br />
KAMCO Research<br />
2003 2004 2005 2006 2007<br />
Return On Assets 9.8% 15.0% 16.2% 11.1% 17.5%<br />
Return On Equity 15.9% 23.6% 22.7% 15.0% 21.6%<br />
Gross Profit Margin 48.7% 55.5% 51.6% 50.2% 52.9%<br />
Operating Profit Margin 29.5% 33.0% 31.1% 30.5% 38.0%<br />
Net Profit Margin 24.6% 34.5% 33.0% 24.3% 34.9%<br />
Current Ratio (X) 3.27<br />
2.59<br />
3.30<br />
3.58<br />
4.79<br />
Quick Ratio (X) 2.50<br />
1.88<br />
2.36<br />
2.67<br />
3.90<br />
Debt / Equity 52.0% 42.9% 26.7% 23.9% 13.2%<br />
Historical Share Data YTD<br />
2004 2005 2006 2007 22-Jun-08<br />
Market Capitalization (KD thousand) 52,000 70,400 73,920 44,100 42,777<br />
Closing Share Price (KD) 0.650 0.880 0.880 0.500 0.520<br />
Highest Price for the Period (KD) 0.650 0.890 NA 0.660 0.550<br />
Lowest Price for the Period (KD) 0.405 0.485 NA 0.500 0.500<br />
Volume (Shares thousand) 265 20,805 0 565 145<br />
Value (KD thousand) 134 11,489 0 303 78<br />
No. of Trades 26 62 0 32 5<br />
EPS (KD) 0.039 0.039 0.027 0.044 0.044<br />
Book Value Per Share (KD) 0.163 0.183 0.182 0.197 0.197<br />
Dividend Per Share (KD) 0.022 0.020 0.020 0.035 NA<br />
Price to Earnings Multiple (X) #<br />
12.58 12.29 17.75 10.98 10.98<br />
Price to Book Value Multiple (X) #<br />
2.97 2.66 2.66 2.46 2.46<br />
Dividend Yield (%) #<br />
4.54 4.12 4.12 7.22 7.22<br />
KD<br />
0.560<br />
0.550<br />
0.540<br />
0.530<br />
0.520<br />
0.510<br />
0.500<br />
0.490<br />
52-Week Price Chart Rel. to KAMCO TRW Index<br />
ALKOUT KAMCO TRW Index<br />
24.6.07<br />
8.7.07<br />
22.7.07<br />
5.8.07<br />
19.8.07<br />
2.9.07<br />
16.9.07<br />
30.9.07<br />
14.10.07<br />
28.10.07<br />
11.11.07<br />
25.11.07<br />
9.12.07<br />
23.12.07<br />
6.1.08<br />
20.1.08<br />
3.2.08<br />
17.2.08<br />
2.3.08<br />
16.3.08<br />
30.3.08<br />
13.4.08<br />
27.4.08<br />
11.5.08<br />
25.5.08<br />
8.6.08<br />
22.6.08<br />
Index<br />
4,800<br />
4,700<br />
4,600<br />
4,500<br />
4,400<br />
4,300<br />
4,200<br />
4,100<br />
4,000<br />
NA: Not Applicable, NM: Not Meaningful<br />
N/A: Not Available. YTD: Beginning of year to date<br />
#<br />
:Historical P/E, P/B & Yield are based on<br />
current price & historical earning per share,<br />
book value per share & dividend per share<br />
Investment Research Department<br />
KIPCO Asset Management Co.K.S.C.C<br />
KAMCO<br />
P.O.Box: 28873 Safat 13149 <strong>Kuwait</strong><br />
Email : kamco_research@kamconline.com


