

Kuwait Corporate Fact Sheet
Kuwait Corporate Fact Sheet
Kuwait Corporate Fact Sheet

Create successful ePaper yourself
Turn your PDF publications into a flip-book with our unique Google optimized e-Paper software.
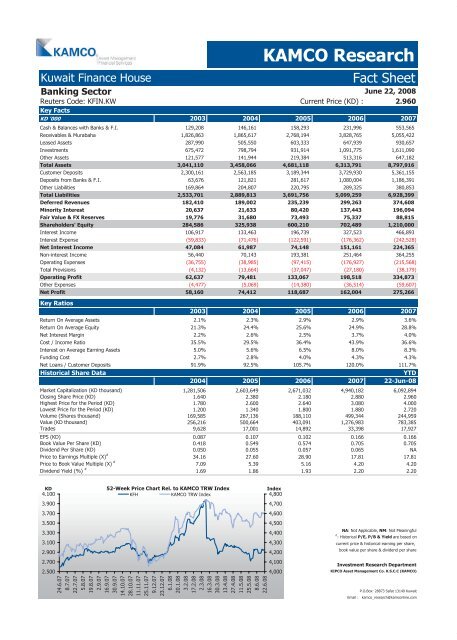
<strong>Kuwait</strong> Finance House <strong>Fact</strong> <strong>Sheet</strong><br />
Banking Sector<br />
KAMCO Research<br />
Reuters Code: KFIN.KW<br />
Key <strong>Fact</strong>s<br />
Current Price (KD) :<br />
June 22, 2008<br />
2.960<br />
KD '000 2003 2004 2005 2006 2007<br />
Cash & Balances with Banks & F.I. 129,208 146,161 158,293 231,996 553,565<br />
Receivables & Murabaha 1,826,863 1,865,617 2,768,194 3,828,765 5,055,422<br />
Leased Assets 287,990 505,550 603,333 647,939 930,657<br />
Investments 675,472 798,794 931,914 1,091,775 1,611,090<br />
Other Assets 121,577 141,944 219,384 513,316 647,182<br />
Total Assets 3,041,110 3,458,066 4,681,118 6,313,791 8,797,916<br />
Customer Deposits 2,300,161 2,563,185 3,189,344 3,729,930 5,361,155<br />
Deposits from Banks & F.I. 63,676 121,821 281,617 1,080,004 1,186,391<br />
Other Liabilities 169,864 204,807 220,795 289,325 380,853<br />
Total Liabilities 2,533,701 2,889,813 3,691,756 5,099,259 6,928,399<br />
Deferred Revenues 182,410 189,002 235,239 299,263 374,608<br />
Minority Interest 20,637 21,633 80,420 137,443 196,094<br />
Fair Value & FX Reserves 19,776 31,680 73,493 75,337 88,815<br />
Shareholders' Equity 284,586 325,938 600,210 702,489 1,210,000<br />
Interest Income 106,917 133,463 196,739 327,523 466,893<br />
Interest Expense (59,833) (71,476) (122,591) (176,362) (242,528)<br />
Net Interest Income 47,084 61,987 74,148 151,161 224,365<br />
Non-interest Income 56,440 70,143 193,381 251,464 364,255<br />
Operating Expenses (36,755) (38,985) (97,415) (176,927) (215,568)<br />
Total Provisions (4,132) (13,664) (37,047) (27,180) (38,179)<br />
Operating Profit 62,637 79,481 133,067 198,518 334,873<br />
Other Expenses (4,477) (5,069) (14,380) (36,514) (59,607)<br />
Net Profit 58,160 74,412 118,687 162,004 275,266<br />
Key Ratios<br />
2003 2004 2005 2006 2007<br />
Return On Average Assets 2.1% 2.3% 2.9% 2.9% 3.6%<br />
Return On Average Equity 21.3% 24.4% 25.6% 24.9% 28.8%<br />
Net Interest Margin 2.2% 2.6% 2.5% 3.7% 4.0%<br />
Cost / Income Ratio 35.5% 29.5% 36.4% 43.9% 36.6%<br />
Interest on Average Earning Assets 5.0% 5.6% 6.5% 8.0% 8.3%<br />
Funding Cost 2.7% 2.8% 4.0% 4.3% 4.3%<br />
Net Loans / Customer Deposits 91.9% 92.5% 105.7% 120.0% 111.7%<br />
Historical Share Data<br />
2004 2005 2006 2007 22-Jun-08<br />
Market Capitalization (KD thousand) 1,281,506 2,603,649 2,671,032 4,940,182 6,092,894<br />
Closing Share Price (KD) 1.640 2.380 2.180 2.880 2.960<br />
Highest Price for the Period (KD) 1.780 2.600 2.640 3.080 4.000<br />
Lowest Price for the Period (KD) 1.200 1.340 1.800 1.880 2.720<br />
Volume (Shares thousand) 169,585 267,136 188,110 499,344 244,959<br />
Value (KD thousand) 256,216 500,664 403,091 1,276,983 783,385<br />
Trades 9,628 17,001 14,892 33,398 17,927<br />
EPS (KD) 0.087 0.107 0.102 0.166 0.166<br />
Book Value Per Share (KD) 0.418 0.549 0.574 0.705 0.705<br />
Dividend Per Share (KD) 0.050 0.055 0.057 0.065 NA<br />
Price to Earnings Multiple (X) #<br />
34.16 27.60 28.90 17.81 17.81<br />
Price to Book Value Multiple (X) #<br />
7.09 5.39 5.16 4.20 4.20<br />
Dividend Yield (%) #<br />
YTD<br />
1.69 1.86 1.93 2.20 2.20<br />
KD<br />
4.100<br />
3.900<br />
3.700<br />
3.500<br />
3.300<br />
3.100<br />
2.900<br />
2.700<br />
2.500<br />
52-Week Price Chart Rel. to KAMCO TRW Index<br />
KFH KAMCO TRW Index<br />
24.6.07<br />
8.7.07<br />
22.7.07<br />
5.8.07<br />
19.8.07<br />
2.9.07<br />
16.9.07<br />
30.9.07<br />
14.10.07<br />
28.10.07<br />
11.11.07<br />
25.11.07<br />
9.12.07<br />
23.12.07<br />
6.1.08<br />
20.1.08<br />
3.2.08<br />
17.2.08<br />
2.3.08<br />
16.3.08<br />
30.3.08<br />
13.4.08<br />
27.4.08<br />
11.5.08<br />
25.5.08<br />
8.6.08<br />
22.6.08<br />
Index<br />
4,800<br />
4,700<br />
4,600<br />
4,500<br />
4,400<br />
4,300<br />
4,200<br />
4,100<br />
4,000<br />
NA: Not Applicable, NM: Not Meaningful<br />
#<br />
: Historical P/E, P/B & Yield are based on<br />
current price & historical earning per share,<br />
book value per share & dividend per share<br />
Investment Research Department<br />
KIPCO Asset Management Co. K.S.C.C (KAMCO)<br />
P.O.Box: 28873 Safat 13149 <strong>Kuwait</strong><br />
Email : kamco_research@kamconline.com


