

Kuwait Corporate Fact Sheet
Kuwait Corporate Fact Sheet
Kuwait Corporate Fact Sheet

You also want an ePaper? Increase the reach of your titles
YUMPU automatically turns print PDFs into web optimized ePapers that Google loves.
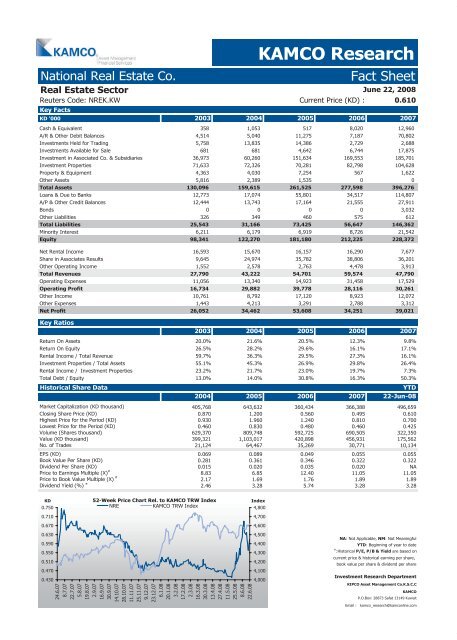
National Real Estate Co.<br />
Real Estate Sector<br />
Reuters Code: NREK.KW Current Price (KD) : 0.610<br />
Key <strong>Fact</strong>s<br />
KD '000 2003 2004 2005 2006 2007<br />
Cash & Equivalent 358 1,053 517 8,020 12,960<br />
A/R & Other Debit Balances 4,514 5,040 11,275 7,187 70,802<br />
Investments Held for Trading 5,758 13,835 14,386 2,729 2,688<br />
Investments Available for Sale 681 681 4,642 6,744 17,875<br />
Investment in Associated Co. & Subsidiaries 36,973 60,260 151,634 169,553 185,701<br />
Investment Properties 71,633 72,326 70,281 82,798 104,628<br />
Property & Equipment 4,363 4,030 7,254 567 1,622<br />
Other Assets 5,816 2,389 1,535 0 0<br />
Total Assets 130,096 159,615 261,525 277,598 396,276<br />
Loans & Due to Banks 12,773 17,074 55,801 34,517 114,807<br />
A/P & Other Credit Balances 12,444 13,743 17,164 21,555 27,911<br />
Bonds 0 0 0 0 3,032<br />
Other Liabilities 326 349 460 575 612<br />
Total Liabilities 25,543 31,166 73,425 56,647 146,362<br />
Minority Interest 6,211 6,179 6,919 8,726 21,542<br />
Equity 98,341 122,270 181,180 212,225 228,372<br />
Net Rental Income 16,593 15,670 16,157 16,290 7,677<br />
Share in Associates Results 9,645 24,974 35,782 38,806 36,201<br />
Other Operating Income 1,552 2,578 2,763 4,478 3,913<br />
Total Revenues 27,790 43,222 54,701 59,574 47,790<br />
Operating Expenses 11,056 13,340 14,923 31,458 17,529<br />
Operating Profit 16,734 29,882 39,778 28,116 30,261<br />
Other Income 10,761 8,792 17,120 8,923 12,072<br />
Other Expenses 1,443 4,213 3,291 2,788 3,312<br />
Net Profit 26,052 34,462 53,608 34,251 39,021<br />
Key Ratios<br />
KAMCO Research<br />
<strong>Fact</strong> <strong>Sheet</strong><br />
June 22, 2008<br />
2003 2004 2005 2006 2007<br />
Return On Assets 20.0% 21.6% 20.5% 12.3% 9.8%<br />
Return On Equity 26.5% 28.2% 29.6% 16.1% 17.1%<br />
Rental Income / Total Revenue 59.7% 36.3% 29.5% 27.3% 16.1%<br />
Investment Properties / Total Assets 55.1% 45.3% 26.9% 29.8% 26.4%<br />
Rental Income / Investment Properties 23.2% 21.7% 23.0% 19.7% 7.3%<br />
Total Debt / Equity 13.0% 14.0% 30.8% 16.3% 50.3%<br />
Historical Share Data YTD<br />
2004 2005 2006 2007 22-Jun-08<br />
Market Capitalization (KD thousand) 405,768 643,632 360,434 366,388 496,659<br />
Closing Share Price (KD) 0.870 1.200 0.560 0.495 0.610<br />
Highest Price for the Period (KD) 0.930 1.960 1.240 0.810 0.700<br />
Lowest Price for the Period (KD) 0.460 0.830 0.480 0.460 0.425<br />
Volume (Shares thousand) 629,370 809,748 592,725 690,505 322,350<br />
Value (KD thousand) 399,321 1,103,017 420,898 456,931 175,562<br />
No. of Trades 21,124 64,467 35,269 30,771 10,134<br />
EPS (KD) 0.069 0.089 0.049 0.055 0.055<br />
Book Value Per Share (KD) 0.281 0.361 0.346 0.322 0.322<br />
Dividend Per Share (KD) 0.015 0.020 0.035 0.020 NA<br />
Price to Earnings Multiple (X) #<br />
8.83 6.85 12.40 11.05 11.05<br />
Price to Book Value Multiple (X) #<br />
2.17 1.69 1.76 1.89 1.89<br />
Dividend Yield (%) #<br />
2.46 3.28 5.74 3.28 3.28<br />
KD<br />
0.750<br />
0.710<br />
0.670<br />
0.630<br />
0.590<br />
0.550<br />
0.510<br />
0.470<br />
0.430<br />
52-Week Price Chart Rel. to KAMCO TRW Index<br />
NRE KAMCO TRW Index<br />
Index<br />
24.6.07<br />
8.7.07<br />
22.7.07<br />
5.8.07<br />
19.8.07<br />
2.9.07<br />
16.9.07<br />
30.9.07<br />
14.10.07<br />
28.10.07<br />
11.11.07<br />
25.11.07<br />
9.12.07<br />
23.12.07<br />
6.1.08<br />
20.1.08<br />
3.2.08<br />
17.2.08<br />
2.3.08<br />
16.3.08<br />
30.3.08<br />
13.4.08<br />
27.4.08<br />
11.5.08<br />
25.5.08<br />
8.6.08<br />
22.6.08<br />
4,800<br />
4,700<br />
4,600<br />
4,500<br />
4,400<br />
4,300<br />
4,200<br />
4,100<br />
4,000<br />
NA: Not Applicable, NM: Not Meaningful<br />
YTD: Beginning of year to date<br />
#<br />
:Historical P/E, P/B & Yield are based on<br />
current price & historical earning per share,<br />
book value per share & dividend per share<br />
Investment Research Department<br />
KIPCO Asset Management Co.K.S.C.C<br />
KAMCO<br />
P.O.Box: 28873 Safat 13149 <strong>Kuwait</strong><br />
Email : kamco_research@kamconline.com


