

Kuwait Corporate Fact Sheet
Kuwait Corporate Fact Sheet
Kuwait Corporate Fact Sheet

Create successful ePaper yourself
Turn your PDF publications into a flip-book with our unique Google optimized e-Paper software.
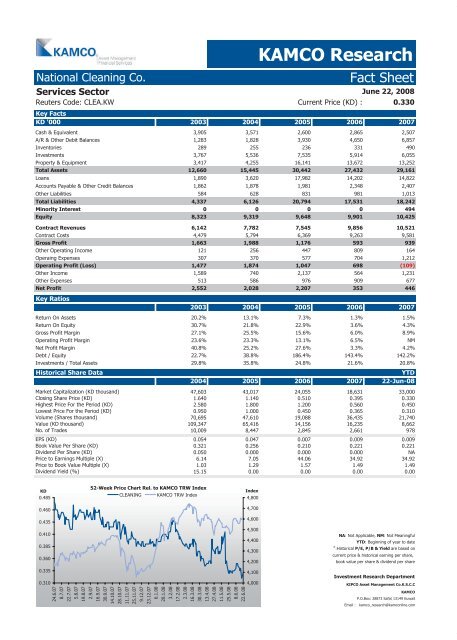
National Cleaning Co. <strong>Fact</strong> <strong>Sheet</strong><br />
Services Sector<br />
KAMCO Research<br />
June 22, 2008<br />
Reuters Code: CLEA.KW Current Price (KD) : 0.330<br />
Key <strong>Fact</strong>s<br />
KD '000 2003 2004 2005 2006 2007<br />
Cash & Equivalent 3,905 3,571 2,600 2,865 2,507<br />
A/R & Other Debit Balances 1,283 1,828 3,930 4,650 6,857<br />
Inventories 289 255 236 331 490<br />
Investments 3,767 5,536 7,535 5,914 6,055<br />
Property & Equipment 3,417 4,255 16,141 13,672 13,252<br />
Total Assets 12,660 15,445 30,442 27,432 29,161<br />
Loans 1,890 3,620 17,982 14,202 14,822<br />
Accounts Payable & Other Credit Balances 1,862 1,878 1,981 2,348 2,407<br />
Other Liabilities 584 628 831 981 1,013<br />
Total Liabilities 4,337 6,126 20,794 17,531 18,242<br />
Minority Interest 0 0 0 0 494<br />
Equity 8,323 9,319 9,648 9,901 10,425<br />
Contract Revenues 6,142 7,782 7,545 9,856 10,521<br />
Contract Costs 4,479 5,794 6,369 9,263 9,581<br />
Gross Profit 1,663 1,988 1,176 593 939<br />
Other Operating Income 121 256 447 809 164<br />
Operaing Expenses 307 370 577 704 1,212<br />
Operating Profit (Loss) 1,477 1,874 1,047 698 (109)<br />
Other Income 1,589 740 2,137 564 1,231<br />
Other Expenses 513 586 976 909 677<br />
Net Profit<br />
Key Ratios<br />
2,552 2,028 2,207 353 446<br />
2003 2004 2005 2006 2007<br />
Return On Assets 20.2% 13.1% 7.3% 1.3% 1.5%<br />
Return On Equity 30.7% 21.8% 22.9% 3.6% 4.3%<br />
Gross Profit Margin 27.1% 25.5% 15.6% 6.0% 8.9%<br />
Operating Profit Margin 23.6% 23.3% 13.1% 6.5% NM<br />
Net Profit Margin 40.8% 25.2% 27.6% 3.3% 4.2%<br />
Debt / Equity 22.7% 38.8% 186.4% 143.4% 142.2%<br />
Investments / Total Assets 29.8% 35.8% 24.8% 21.6% 20.8%<br />
Historical Share Data YTD<br />
2004 2005 2006 2007 22-Jun-08<br />
Market Capitalization (KD thousand) 47,603 43,017 24,055 18,631 33,000<br />
Closing Share Price (KD) 1.640 1.140 0.510 0.395 0.330<br />
Highest Price For the Period (KD) 2.580 1.800 1.200 0.560 0.450<br />
Lowest Price For the Period (KD) 0.950 1.000 0.450 0.365 0.310<br />
Volume (Shares thousand) 70,695 47,610 19,088 36,435 21,740<br />
Value (KD thousand) 109,347 65,416 14,156 16,235 8,662<br />
No. of Trades 10,009 8,447 2,845 2,661 978<br />
EPS (KD) 0.054 0.047 0.007 0.009 0.009<br />
Book Value Per Share (KD) 0.321 0.256 0.210 0.221 0.221<br />
Dividend Per Share (KD) 0.050 0.000 0.000 0.000 NA<br />
Price to Earnings Multiple (X) 6.14 7.05 44.06 34.92 34.92<br />
Price to Book Value Multiple (X) 1.03 1.29 1.57 1.49 1.49<br />
Dividend Yield (%) 15.15 0.00 0.00 0.00 0.00<br />
KD<br />
0.485<br />
0.460<br />
0.435<br />
0.410<br />
0.385<br />
0.360<br />
0.335<br />
0.310<br />
52-Week Price Chart Rel. to KAMCO TRW Index<br />
CLEANING KAMCO TRW Index<br />
24.6.07<br />
8.7.07<br />
22.7.07<br />
5.8.07<br />
19.8.07<br />
2.9.07<br />
16.9.07<br />
30.9.07<br />
14.10.07<br />
28.10.07<br />
11.11.07<br />
25.11.07<br />
9.12.07<br />
23.12.07<br />
6.1.08<br />
20.1.08<br />
3.2.08<br />
17.2.08<br />
2.3.08<br />
16.3.08<br />
30.3.08<br />
13.4.08<br />
27.4.08<br />
11.5.08<br />
25.5.08<br />
8.6.08<br />
22.6.08<br />
Index<br />
4,800<br />
4,700<br />
4,600<br />
4,500<br />
4,400<br />
4,300<br />
4,200<br />
4,100<br />
4,000<br />
NA: Not Applicable, NM: Not Meaningful<br />
YTD: Beginning of year to date<br />
#<br />
:Historical P/E, P/B & Yield are based on<br />
current price & historical earning per share,<br />
book value per share & dividend per share<br />
Investment Research Department<br />
KIPCO Asset Management Co.K.S.C.C<br />
KAMCO<br />
P.O.Box: 28873 Safat 13149 <strong>Kuwait</strong><br />
Email : kamco_research@kamconline.com


