

Kuwait Corporate Fact Sheet
Kuwait Corporate Fact Sheet
Kuwait Corporate Fact Sheet

Create successful ePaper yourself
Turn your PDF publications into a flip-book with our unique Google optimized e-Paper software.
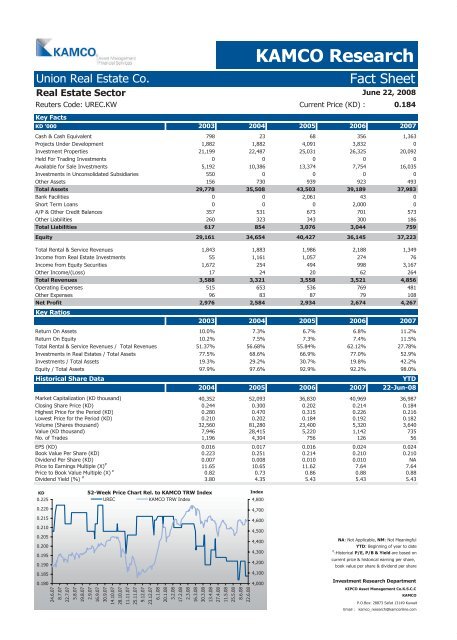
Union Real Estate Co. <strong>Fact</strong> <strong>Sheet</strong><br />
Real Estate Sector<br />
Reuters Code: UREC.KW Current Price (KD) : 0.184<br />
Key <strong>Fact</strong>s<br />
KAMCO Research<br />
June 22, 2008<br />
KD '000 2003 2004 2005 2006 2007<br />
Cash & Cash Equivalent 798 23 68 356 1,363<br />
Projects Under Development 1,882 1,882 4,091 3,832 0<br />
Investment Properties 21,199 22,487 25,031 26,325 20,092<br />
Held For Trading Investments 0 0 0 0 0<br />
Available for Sale Investments 5,192 10,386 13,374 7,754 16,035<br />
Investments in Unconsolidated Subsidiaries 550 0 0 0 0<br />
Other Assets 156 730 939 923 493<br />
Total Assets 29,778 35,508 43,503 39,189 37,983<br />
Bank Facilities 0 0 2,061 43 0<br />
Short Term Loans 0 0 0 2,000 0<br />
A/P & Other Credit Balances 357 531 673 701 573<br />
Other Liabilities 260 323 343 300 186<br />
Total Liabilities 617 854 3,076 3,044 759<br />
Equity 29,161 34,654 40,427 36,145 37,223<br />
Total Rental & Service Revenues 1,843 1,883 1,986 2,188 1,349<br />
Income from Real Estate Investments 55 1,161 1,057 274 76<br />
Income from Equity Securities 1,672 254 494 998 3,167<br />
Other Income/(Loss) 17 24 20 62 264<br />
Total Revenues 3,588 3,321 3,558 3,521 4,856<br />
Operating Expenses 515 653 536 769 481<br />
Other Expenses 96 83 87 79 108<br />
Net Profit<br />
Key Ratios<br />
2,976 2,584 2,934 2,674 4,267<br />
2003 2004 2005 2006 2007<br />
Return On Assets 10.0% 7.3% 6.7% 6.8% 11.2%<br />
Return On Equity 10.2% 7.5% 7.3% 7.4% 11.5%<br />
Total Rental & Service Revenues / Total Revenues 51.37% 56.68% 55.84% 62.12% 27.78%<br />
Investments in Real Estates / Total Assets 77.5% 68.6% 66.9% 77.0% 52.9%<br />
Investments / Total Assets 19.3% 29.2% 30.7% 19.8% 42.2%<br />
Equity / Total Assets 97.9% 97.6% 92.9% 92.2% 98.0%<br />
Historical Share Data YTD<br />
2004 2005 2006 2007 22-Jun-08<br />
Market Capitalization (KD thousand) 40,352 52,093 36,830 40,969 36,987<br />
Closing Share Price (KD) 0.244 0.300 0.202 0.214 0.184<br />
Highest Price for the Period (KD) 0.280 0.470 0.315 0.226 0.216<br />
Lowest Price for the Period (KD) 0.210 0.202 0.184 0.192 0.182<br />
Volume (Shares thousand) 32,560 81,280 23,400 5,320 3,640<br />
Value (KD thousand) 7,946 28,415 5,220 1,142 735<br />
No. of Trades 1,196 4,304 756 126 56<br />
EPS (KD) 0.016 0.017 0.016 0.024 0.024<br />
Book Value Per Share (KD) 0.223 0.251 0.214 0.210 0.210<br />
Dividend Per Share (KD) 0.007 0.008 0.010 0.010 NA<br />
Price to Earnings Multiple (X) #<br />
11.65 10.65 11.62 7.64 7.64<br />
Price to Book Value Multiple (X) #<br />
0.82 0.73 0.86 0.88 0.88<br />
Dividend Yield (%) #<br />
3.80 4.35 5.43 5.43 5.43<br />
KD<br />
0.225<br />
0.220<br />
0.215<br />
0.210<br />
0.205<br />
0.200<br />
0.195<br />
0.190<br />
0.185<br />
0.180<br />
Index<br />
24.6.07<br />
8.7.07<br />
22.7.07<br />
5.8.07<br />
19.8.07<br />
2.9.07<br />
16.9.07<br />
30.9.07<br />
14.10.07<br />
28.10.07<br />
11.11.07<br />
25.11.07<br />
9.12.07<br />
23.12.07<br />
6.1.08<br />
20.1.08<br />
3.2.08<br />
17.2.08<br />
2.3.08<br />
16.3.08<br />
30.3.08<br />
13.4.08<br />
27.4.08<br />
11.5.08<br />
25.5.08<br />
8.6.08<br />
22.6.08<br />
52-Week Price Chart Rel. to KAMCO TRW Index<br />
UREC KAMCO TRW Index<br />
4,800<br />
4,700<br />
4,600<br />
4,500<br />
4,400<br />
4,300<br />
4,200<br />
4,100<br />
4,000<br />
NA: Not Applicable, NM: Not Meaningful<br />
YTD: Beginning of year to date<br />
#<br />
:Historical P/E, P/B & Yield are based on<br />
current price & historical earning per share,<br />
book value per share & dividend per share<br />
Investment Research Department<br />
KIPCO Asset Management Co.K.S.C.C<br />
KAMCO<br />
P.O.Box: 28873 Safat 13149 <strong>Kuwait</strong><br />
Email : kamco_research@kamconline.com


