

Kuwait Corporate Fact Sheet
Kuwait Corporate Fact Sheet
Kuwait Corporate Fact Sheet

Create successful ePaper yourself
Turn your PDF publications into a flip-book with our unique Google optimized e-Paper software.
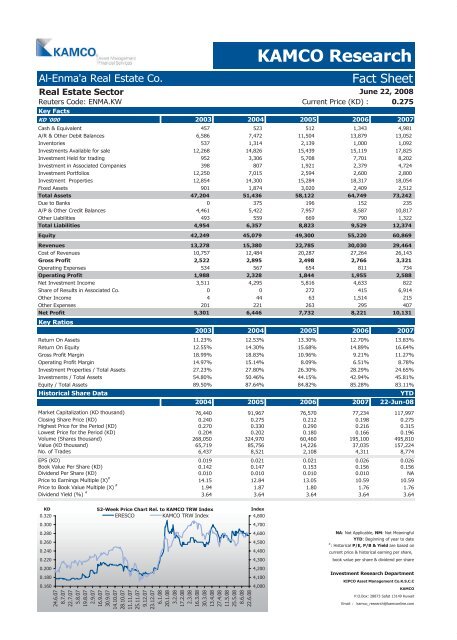
Al-Enma'a Real Estate Co. <strong>Fact</strong> <strong>Sheet</strong><br />
Real Estate Sector<br />
KAMCO Research<br />
June 22, 2008<br />
Reuters Code: ENMA.KW<br />
Key <strong>Fact</strong>s<br />
Current Price (KD) : 0.275<br />
KD '000 2003 2004 2005 2006 2007<br />
Cash & Equivalent 457 523 512 1,343 4,981<br />
A/R & Other Debit Balances 6,586 7,472 11,504 13,879 13,052<br />
Inventories 537 1,314 2,139 1,000 1,092<br />
Investments Available for sale 12,268 14,826 15,439 15,119 17,825<br />
Investment Held for trading 952 3,306 5,708 7,701 8,202<br />
Investment in Associated Companies 398 807 1,921 2,379 4,724<br />
Investment Portfolios 12,250 7,015 2,594 2,600 2,800<br />
Investment Properties 12,854 14,300 15,284 18,317 18,054<br />
Fixed Assets 901 1,874 3,020 2,409 2,512<br />
Total Assets 47,204 51,436 58,122 64,749 73,242<br />
Due to Banks 0 375 196 152 235<br />
A/P & Other Credit Balances 4,461 5,422 7,957 8,587 10,817<br />
Other Liabilities 493 559 669 790 1,322<br />
Total Liabilities 4,954 6,357 8,823 9,529 12,374<br />
Equity 42,249 45,079 49,300 55,220 60,869<br />
Revenues 13,278 15,380 22,785 30,030 29,464<br />
Cost of Revenues 10,757 12,484 20,287 27,264 26,143<br />
Gross Profit 2,522 2,895 2,498 2,766 3,321<br />
Operating Expenses 534 567 654 811 734<br />
Operating Profit 1,988 2,328 1,844 1,955 2,588<br />
Net Investment Income 3,511 4,295 5,816 4,633 822<br />
Share of Results in Associated Co. 0 0 272 415 6,914<br />
Other Income 4 44 63 1,514 215<br />
Other Expenses 201 221 263 295 407<br />
Net Profit<br />
Key Ratios<br />
5,301 6,446 7,732 8,221 10,131<br />
2003 2004 2005 2006 2007<br />
Return On Assets 11.23% 12.53% 13.30% 12.70% 13.83%<br />
Return On Equity 12.55% 14.30% 15.68% 14.89% 16.64%<br />
Gross Profit Margin 18.99% 18.83% 10.96% 9.21% 11.27%<br />
Operating Profit Margin 14.97% 15.14% 8.09% 6.51% 8.78%<br />
Investment Properties / Total Assets 27.23% 27.80% 26.30% 28.29% 24.65%<br />
Investments / Total Assets 54.80% 50.46% 44.15% 42.94% 45.81%<br />
Equity / Total Assets 89.50% 87.64% 84.82% 85.28% 83.11%<br />
Historical Share Data YTD<br />
2004 2005 2006 2007 22-Jun-08<br />
Market Capitalization (KD thousand) 76,440 91,967 76,570 77,234 117,997<br />
Closing Share Price (KD) 0.240 0.275 0.212 0.198 0.275<br />
Highest Price for the Period (KD) 0.270 0.330 0.290 0.216 0.315<br />
Lowest Price for the Period (KD) 0.204 0.202 0.180 0.166 0.196<br />
Volume (Shares thousand) 268,050 324,970 60,460 195,100 495,810<br />
Value (KD thousand) 65,719 85,756 14,226 37,035 157,224<br />
No. of Trades 6,437 8,521 2,108 4,311 8,774<br />
EPS (KD) 0.019 0.021 0.021 0.026 0.026<br />
Book Value Per Share (KD) 0.142 0.147 0.153 0.156 0.156<br />
Dividend Per Share (KD) 0.010 0.010 0.010 0.010 NA<br />
Price to Earnings Multiple (X) #<br />
14.15 12.84 13.05 10.59 10.59<br />
Price to Book Value Multiple (X) #<br />
1.94 1.87 1.80 1.76 1.76<br />
Dividend Yield (%) #<br />
3.64 3.64 3.64 3.64 3.64<br />
KD<br />
0.320<br />
0.300<br />
0.280<br />
0.260<br />
0.240<br />
0.220<br />
0.200<br />
0.180<br />
0.160<br />
Index<br />
24.6.07<br />
8.7.07<br />
22.7.07<br />
5.8.07<br />
19.8.07<br />
2.9.07<br />
16.9.07<br />
30.9.07<br />
14.10.07<br />
28.10.07<br />
11.11.07<br />
25.11.07<br />
9.12.07<br />
23.12.07<br />
6.1.08<br />
20.1.08<br />
3.2.08<br />
17.2.08<br />
2.3.08<br />
16.3.08<br />
30.3.08<br />
13.4.08<br />
27.4.08<br />
11.5.08<br />
25.5.08<br />
8.6.08<br />
22.6.08<br />
52-Week Price Chart Rel. to KAMCO TRW Index<br />
ERESCO KAMCO TRW Index<br />
4,800<br />
4,700<br />
4,600<br />
4,500<br />
4,400<br />
4,300<br />
4,200<br />
4,100<br />
4,000<br />
NA: Not Applicable, NM: Not Meaningful<br />
YTD: Beginning of year to date<br />
#<br />
: Historical P/E, P/B & Yield are based on<br />
current price & historical earning per share,<br />
book value per share & dividend per share<br />
Investment Research Department<br />
KIPCO Asset Management Co.K.S.C.C<br />
KAMCO<br />
P.O.Box: 28873 Safat 13149 <strong>Kuwait</strong><br />
Email : kamco_research@kamconline.com


