

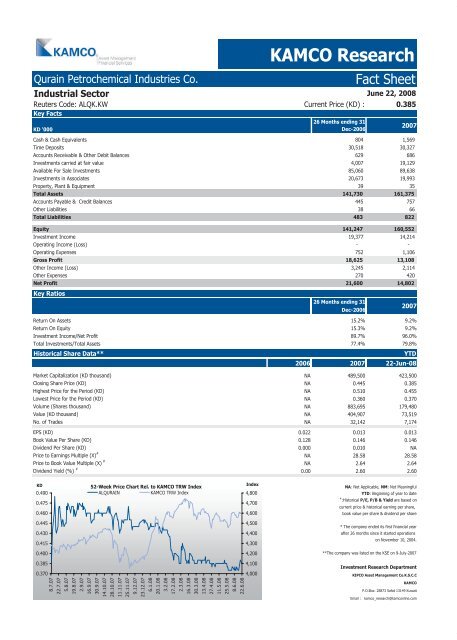
Kuwait Corporate Fact Sheet
Kuwait Corporate Fact Sheet
Kuwait Corporate Fact Sheet

Create successful ePaper yourself
Turn your PDF publications into a flip-book with our unique Google optimized e-Paper software.
Qurain Petrochemical Industries Co. <strong>Fact</strong> <strong>Sheet</strong><br />
Industrial Sector<br />
Reuters Code: ALQK.KW Current Price (KD) : 0.385<br />
Key <strong>Fact</strong>s<br />
KD '000<br />
Cash & Cash Equivalents 804 1,569<br />
Time Deposits 30,518 30,327<br />
Accounts Receivable & Other Debit Balances 629 686<br />
Investments carried at fair value 4,007 19,129<br />
Available For Sale Investments 85,060 89,638<br />
Investments in Associates 20,673 19,993<br />
Property, Plant & Equipment 39 35<br />
Total Assets 141,730 161,375<br />
Accounts Payable & Credit Balances 445 757<br />
Other Liabilities 38 66<br />
Total Liabilities 483 822<br />
Equity 141,247 160,552<br />
Investment Income 19,377 14,214<br />
Operating Income (Loss) -<br />
-<br />
Operating Expenses 752 1,106<br />
Gross Profit 18,625 13,108<br />
Other Income (Loss) 3,245 2,114<br />
Other Expenses 270 420<br />
Net Profit 21,600 14,802<br />
Key Ratios<br />
Return On Assets 15.2% 9.2%<br />
Return On Equity 15.3% 9.2%<br />
Investment Income/Net Profit 89.7% 96.0%<br />
Total Investments/Total Assets 77.4% 79.8%<br />
Historical Share Data** YTD<br />
2006 2007 22-Jun-08<br />
Market Capitalization (KD thousand) NA 489,500 423,500<br />
Closing Share Price (KD) NA 0.445 0.385<br />
Highest Price for the Period (KD) NA 0.510 0.455<br />
Lowest Price for the Period (KD) NA 0.360 0.370<br />
Volume (Shares thousand) NA 883,695 179,480<br />
Value (KD thousand) NA 404,907 73,519<br />
No. of Trades NA 32,142 7,174<br />
EPS (KD) 0.022 0.013 0.013<br />
Book Value Per Share (KD) 0.128 0.146 0.146<br />
Dividend Per Share (KD) 0.000 0.010 NA<br />
Price to Earnings Multiple (X) #<br />
NA 28.58 28.58<br />
Price to Book Value Multiple (X) #<br />
NA 2.64 2.64<br />
Dividend Yield (%) #<br />
0.00 2.60 2.60<br />
KD<br />
0.490<br />
0.475<br />
0.460<br />
0.445<br />
0.430<br />
0.415<br />
0.400<br />
0.385<br />
0.370<br />
8.7.07<br />
22.7.07<br />
5.8.07<br />
19.8.07<br />
2.9.07<br />
16.9.07<br />
52-Week Price Chart Rel. to KAMCO TRW Index<br />
ALQURAIN KAMCO TRW Index<br />
30.9.07<br />
14.10.07<br />
28.10.07<br />
11.11.07<br />
25.11.07<br />
9.12.07<br />
23.12.07<br />
6.1.08<br />
20.1.08<br />
3.2.08<br />
17.2.08<br />
2.3.08<br />
16.3.08<br />
30.3.08<br />
13.4.08<br />
27.4.08<br />
11.5.08<br />
25.5.08<br />
8.6.08<br />
22.6.08<br />
Index<br />
4,800<br />
4,700<br />
4,600<br />
4,500<br />
4,400<br />
4,300<br />
4,200<br />
4,100<br />
4,000<br />
KAMCO Research<br />
26 Months ending 31<br />
Dec-2006<br />
26 Months ending 31<br />
Dec-2006<br />
June 22, 2008<br />
2007<br />
2007<br />
NA: Not Applicable, NM: Not Meaningful<br />
YTD: Beginning of year to date<br />
#<br />
:Historical P/E, P/B & Yield are based on<br />
current price & historical earning per share,<br />
book value per share & dividend per share<br />
* The company ended its first financial year<br />
after 26 months since it started operations<br />
on November 10, 2004.<br />
**The company was listed on the KSE on 9-July-2007<br />
Investment Research Department<br />
KIPCO Asset Management Co.K.S.C.C<br />
KAMCO<br />
P.O.Box: 28873 Safat 13149 <strong>Kuwait</strong><br />
Email : kamco_research@kamconline.com


