

Kuwait Corporate Fact Sheet
Kuwait Corporate Fact Sheet
Kuwait Corporate Fact Sheet

Create successful ePaper yourself
Turn your PDF publications into a flip-book with our unique Google optimized e-Paper software.
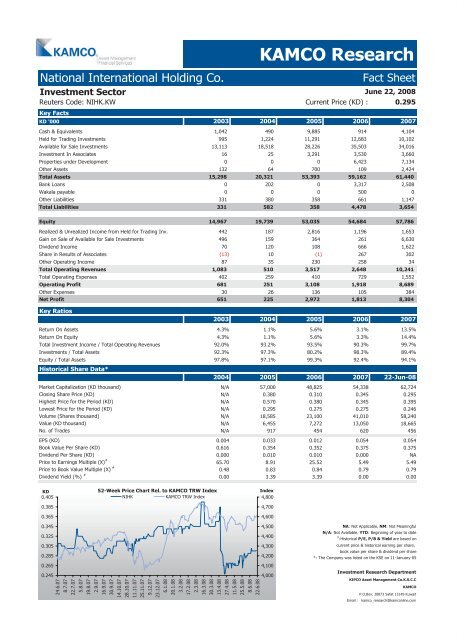
National International Holding Co. <strong>Fact</strong> <strong>Sheet</strong><br />
Investment Sector<br />
Reuters Code: NIHK.KW Current Price (KD) : 0.295<br />
Key <strong>Fact</strong>s<br />
KD '000 2003 2004 2005 2006 2007<br />
Cash & Equivalents 1,042 490 9,885 914 4,104<br />
Held for Trading Investments 995 1,224 11,291 12,683 10,102<br />
Available for Sale Investments 13,113 18,518 28,226 35,503 34,016<br />
Investment In Associates 16 25 3,291 3,530 3,660<br />
Properties under Development 0 0 0 6,423 7,134<br />
Other Assets 132 64 700 109 2,424<br />
Total Assets 15,298 20,321 53,393 59,162 61,440<br />
Bank Loans 0 202 0 3,317 2,508<br />
Wakala payable 0 0 0 500 0<br />
Other Liabilities 331 380 358 661 1,147<br />
Total Liabilities 331 582 358 4,478 3,654<br />
Equity 14,967 19,739 53,035 54,684 57,786<br />
Realized & Unrealized Income from Held for Trading Inv. 442 187 2,816 1,196 1,653<br />
Gain on Sale of Available for Sale Investments 496 159 364 261 6,630<br />
Dividend Income 70 120 108 666 1,622<br />
Share in Results of Associates (13) 10 (1) 267 302<br />
Other Operating Income 87 35 230 258 34<br />
Total Operating Revenues 1,083 510 3,517 2,648 10,241<br />
Total Operating Expenses 402 259 410 729 1,552<br />
Operating Profit 681 251 3,108 1,918 8,689<br />
Other Expenses 30 26 136 105 384<br />
Net Profit 651 225 2,972 1,813 8,304<br />
Key Ratios<br />
KAMCO Research<br />
June 22, 2008<br />
2003 2004 2005 2006 2007<br />
Return On Assets 4.3% 1.1% 5.6% 3.1% 13.5%<br />
Return On Equity 4.3% 1.1% 5.6% 3.3% 14.4%<br />
Total Investment Income / Total Operating Revenues 92.0% 93.2% 93.5% 90.3% 99.7%<br />
Investments / Total Assets 92.3% 97.3% 80.2% 98.3% 89.4%<br />
Equity / Total Assets<br />
Historical Share Data*<br />
97.8% 97.1% 99.3% 92.4% 94.1%<br />
2004 2005 2006 2007 22-Jun-08<br />
Market Capitalization (KD thousand) N/A 57,000 48,825 54,338 62,724<br />
Closing Share Price (KD) N/A 0.380 0.310 0.345 0.295<br />
Highest Price for the Period (KD) N/A 0.570 0.380 0.345 0.395<br />
Lowest Price for the Period (KD) N/A 0.295 0.275 0.275 0.246<br />
Volume (Shares thousand) N/A 18,585 23,100 41,010 58,240<br />
Value (KD thousand) N/A 6,455 7,272 13,050 18,665<br />
No. of Trades N/A 917 454 620 456<br />
EPS (KD) 0.004 0.033 0.012 0.054 0.054<br />
Book Value Per Share (KD) 0.616 0.354 0.352 0.375 0.375<br />
Dividend Per Share (KD) 0.000 0.010 0.010 0.000 NA<br />
Price to Earnings Multiple (X) #<br />
65.70 8.91 25.52 5.49 5.49<br />
Price to Book Value Multiple (X) #<br />
0.48 0.83 0.84 0.79 0.79<br />
Dividend Yield (%) #<br />
0.00 3.39 3.39 0.00 0.00<br />
KD<br />
0.405<br />
0.385<br />
0.365<br />
0.345<br />
0.325<br />
0.305<br />
0.285<br />
0.265<br />
0.245<br />
52-Week Price Chart Rel. to KAMCO TRW Index<br />
NIHK KAMCO TRW Index<br />
24.6.07<br />
8.7.07<br />
22.7.07<br />
5.8.07<br />
19.8.07<br />
2.9.07<br />
16.9.07<br />
30.9.07<br />
14.10.07<br />
28.10.07<br />
11.11.07<br />
25.11.07<br />
9.12.07<br />
23.12.07<br />
6.1.08<br />
20.1.08<br />
3.2.08<br />
17.2.08<br />
2.3.08<br />
16.3.08<br />
30.3.08<br />
13.4.08<br />
27.4.08<br />
11.5.08<br />
25.5.08<br />
8.6.08<br />
22.6.08<br />
Index<br />
4,800<br />
4,700<br />
4,600<br />
4,500<br />
4,400<br />
4,300<br />
4,200<br />
4,100<br />
4,000<br />
NA: Not Applicable, NM: Not Meaningful<br />
N/A: Not Available. YTD: Beginning of year to date<br />
#<br />
:Historical P/E, P/B & Yield are based on<br />
current price & historical earning per share,<br />
book value per share & dividend per share<br />
*: The Company was listed on the KSE on 11-January-05<br />
Investment Research Department<br />
KIPCO Asset Management Co.K.S.C.C<br />
KAMCO<br />
P.O.Box: 28873 Safat 13149 <strong>Kuwait</strong><br />
Email : kamco_research@kamconline.com


