

Kuwait Corporate Fact Sheet
Kuwait Corporate Fact Sheet
Kuwait Corporate Fact Sheet

You also want an ePaper? Increase the reach of your titles
YUMPU automatically turns print PDFs into web optimized ePapers that Google loves.
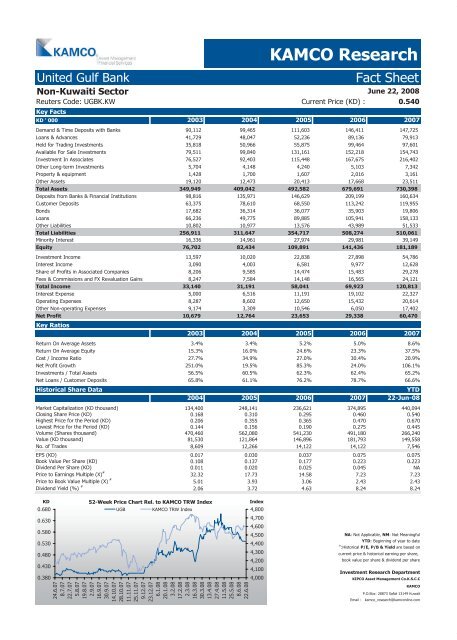
United Gulf Bank <strong>Fact</strong> <strong>Sheet</strong><br />
Non-<strong>Kuwait</strong>i Sector<br />
Reuters Code: UGBK.KW Current Price (KD) : 0.540<br />
Key <strong>Fact</strong>s<br />
KAMCO Research<br />
June 22, 2008<br />
KD ' 000 2003 2004 2005 2006 2007<br />
Demand & Time Deposits with Banks 90,112 99,465 111,603 146,411 147,725<br />
Loans & Advances 41,729 48,047 52,236 89,136 79,913<br />
Held for Trading Investments 35,818 50,966 55,875 99,464 97,601<br />
Available For Sale Investments 79,511 99,840 131,161 152,218 154,743<br />
Investment In Associates 76,527 92,403 115,448 167,675 216,402<br />
Other Long-term Investments 5,704 4,148 4,240 5,103 7,342<br />
Property & equipment 1,428 1,700 1,607 2,016 3,161<br />
Other Assets 19,120 12,473 20,413 17,668 23,511<br />
Total Assets 349,949 409,042 492,582 679,691 730,398<br />
Deposits from Banks & Financial Institutions 98,816 135,971 146,629 209,199 160,634<br />
Customer Deposits 63,375 78,610 68,550 113,242 119,955<br />
Bonds 17,682 36,314 36,077 35,903 19,806<br />
Loans 66,236 49,775 89,885 105,941 158,133<br />
Other Liabilities 10,802 10,977 13,576 43,989 51,533<br />
Total Liabilities 256,911 311,647 354,717 508,274 510,061<br />
Minority Interest 16,336 14,961 27,974 29,981 39,149<br />
Equity 76,702 82,434 109,891 141,436 181,189<br />
Investment Income 13,597 10,020 22,838 27,898 54,786<br />
Interest Income 3,090 4,003 6,581 9,977 12,628<br />
Share of Profits in Associated Companies 8,206 9,585 14,474 15,483 29,278<br />
Fees & Commissions and FX Revaluation Gains 8,247 7,584 14,148 16,565 24,121<br />
Total Income 33,140 31,191 58,041 69,923 120,813<br />
Interest Expense 5,000 6,516 11,191 19,102 22,327<br />
Operating Expenses 8,287 8,602 12,650 15,432 20,614<br />
Other Non-operating Expenses 9,174 3,309 10,546 6,050 17,402<br />
Net Profit<br />
Key Ratios<br />
10,679 12,764 23,653 29,338 60,470<br />
2003 2004 2005 2006 2007<br />
Return On Average Assets 3.4% 3.4% 5.2% 5.0% 8.6%<br />
Return On Average Equity 15.3% 16.0% 24.6% 23.3% 37.5%<br />
Cost / Income Ratio 27.7% 34.9% 27.0% 30.4% 20.9%<br />
Net Profit Growth 251.0% 19.5% 85.3% 24.0% 106.1%<br />
Investments / Total Assets 56.5% 60.5% 62.3% 62.4% 65.2%<br />
Net Loans / Customer Deposits 65.8% 61.1% 76.2% 78.7% 66.6%<br />
Historical Share Data YTD<br />
2004 2005 2006 2007 22-Jun-08<br />
Market Capitalization (KD thousand) 134,400 248,141 236,621 374,895 440,094<br />
Closing Share Price (KD) 0.168 0.310 0.295 0.460 0.540<br />
Highest Price for the Period (KD) 0.206 0.355 0.365 0.470 0.670<br />
Lowest Price for the Period (KD) 0.144 0.156 0.190 0.275 0.445<br />
Volume (Shares thousand) 470,460 562,080 541,230 491,180 266,240<br />
Value (KD thousand) 81,530 121,864 146,896 181,793 149,558<br />
No. of Trades 8,609 12,266 14,122 14,122 7,546<br />
EPS (KD) 0.017 0.030 0.037 0.075 0.075<br />
Book Value Per Share (KD) 0.108 0.137 0.177 0.223 0.223<br />
Dividend Per Share (KD) 0.011 0.020 0.025 0.045 NA<br />
Price to Earnings Multiple (X) #<br />
32.32 17.73 14.58 7.23 7.23<br />
Price to Book Value Multiple (X) #<br />
5.01 3.93 3.06 2.43 2.43<br />
Dividend Yield (%) #<br />
2.06 3.72 4.63 8.24 8.24<br />
KD<br />
0.680<br />
0.630<br />
0.580<br />
0.530<br />
0.480<br />
0.430<br />
0.380<br />
52-Week Price Chart Rel. to KAMCO TRW Index<br />
UGB KAMCO TRW Index<br />
24.6.07<br />
8.7.07<br />
22.7.07<br />
5.8.07<br />
19.8.07<br />
2.9.07<br />
16.9.07<br />
30.9.07<br />
14.10.07<br />
28.10.07<br />
11.11.07<br />
25.11.07<br />
9.12.07<br />
23.12.07<br />
6.1.08<br />
20.1.08<br />
3.2.08<br />
17.2.08<br />
2.3.08<br />
16.3.08<br />
30.3.08<br />
13.4.08<br />
27.4.08<br />
11.5.08<br />
25.5.08<br />
8.6.08<br />
22.6.08<br />
Index<br />
4,800<br />
4,700<br />
4,600<br />
4,500<br />
4,400<br />
4,300<br />
4,200<br />
4,100<br />
4,000<br />
NA: Not Applicable, NM: Not Meaningful<br />
YTD: Beginning of year to date<br />
#<br />
:Historical P/E, P/B & Yield are based on<br />
current price & historical earning per share,<br />
book value per share & dividend per share<br />
Investment Research Department<br />
KIPCO Asset Management Co.K.S.C.C<br />
KAMCO<br />
P.O.Box: 28873 Safat 13149 <strong>Kuwait</strong><br />
Email : kamco_research@kamconline.com


