

Kuwait Corporate Fact Sheet
Kuwait Corporate Fact Sheet
Kuwait Corporate Fact Sheet

Create successful ePaper yourself
Turn your PDF publications into a flip-book with our unique Google optimized e-Paper software.
<strong>Kuwait</strong> Resorts Co. <strong>Fact</strong> <strong>Sheet</strong><br />
Services Sector<br />
Reuters Code: MUNK.KW Current Price (KD) : 0.240<br />
Key <strong>Fact</strong>s<br />
KD '000 2003 2004 2005 2006 2007<br />
Cash & Equivalents 1,720 3,847 2,266 2,790 2,960<br />
Accounts Receivable & Other Receivables 2,104 1,512 2,595 2,709 2,995<br />
Inventories 111 110 97 66 76<br />
Investments 14,542 17,231 16,170 17,215 34,656<br />
Property & Equipment 29,252 26,859 24,801 23,418 21,813<br />
Total Assets 47,730 49,558 45,928 46,199 62,501<br />
Due to Banks 16,900 17,406 3,920 5,067 12,635<br />
Due to Related Parties 7,643 7,353 9,197 8,404 6,905<br />
Accounts Payables 6,592 5,959 6,645 6,648 3,097<br />
Other Liabilities 63 97 138 179 10,381<br />
Total Liabilities 31,198 30,815 19,901 20,297 33,018<br />
Equity 16,532 18,743 26,028 25,901 29,482<br />
Sales 11,440 10,861 12,086 11,356 11,057<br />
Cost of Sales 9,031 7,758 8,293 8,063 7,866<br />
Gross Profit 2,409 3,103 3,793 3,293 3,191<br />
Operating Expenses 345 203 241 358 657<br />
Operating Profit 2,064 2,900 3,552 2,935 2,534<br />
Investment Income 5,326 722 1,745 343 3,908<br />
Other Income 2 0 60 83 491<br />
Finance Charges (1,230) (1,561) (1,586) (1,387) (1,834)<br />
Other Expenses (87) (48) (61) (74) (205)<br />
Net Profit 6,075 2,013 3,710 1,900 4,894<br />
Key Ratios<br />
KAMCO Research<br />
June 22, 2008<br />
2003 2004 2005 2006 2007<br />
Return On Assets 12.7% 4.1% 8.1% 4.1% 7.8%<br />
Return On Equity 36.7% 10.7% 14.3% 7.3% 16.6%<br />
Gross Profit Margin 21.1% 28.6% 31.4% 29.0% 28.9%<br />
Operating Profit Margin 18.0% 26.7% 29.4% 25.8% 22.9%<br />
Net Profit Margin 53.1% 18.5% 30.7% 16.7% 44.3%<br />
Debt / Equity 102.2% 92.9% 15.1% 19.6% 42.9%<br />
Historical Share Data* YTD<br />
2004 2005 2006 2007 22-Jun-08<br />
Market Capitalization (KD thousand) N/A N/A N/A 33,957 44,906<br />
Closing Share Price (KD) N/A N/A N/A 0.196 0.240<br />
Highest Price For the Period (KD) N/A N/A N/A 0.265 0.255<br />
Lowest Price For the Period (KD) N/A N/A N/A 0.176 0.182<br />
Volume (Shares thousand) N/A N/A N/A 100,260 118,200<br />
Value (KD thousand) N/A N/A N/A 23,146 26,095<br />
No. of Trades N/A N/A N/A 2,711 2,410<br />
EPS (KD) 0.019 0.028 0.011 0.028 0.028<br />
Book Value Per Share (KD) 0.179 0.174 0.157 0.171 0.171<br />
Dividend Per Share (KD) 0.008 0.005 0.005 0.010 NA<br />
Price to Earnings Multiple (X) #<br />
12.47 8.62 21.88 8.48 8.48<br />
Price to Book Value Multiple (X) #<br />
1.34 1.38 1.53 1.40 1.40<br />
Dividend Yield (%) #<br />
3.33 2.08 2.08 4.17 4.17<br />
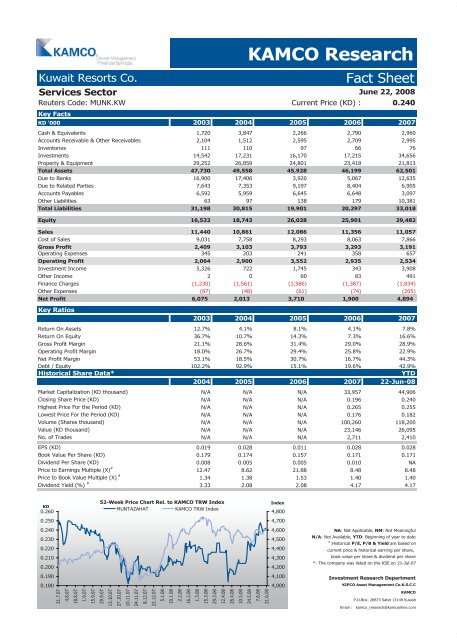
KD<br />
0.260<br />
0.250<br />
0.240<br />
0.230<br />
0.220<br />
0.210<br />
0.200<br />
0.190<br />
0.180<br />
21.7.07<br />
4.8.07<br />
18.8.07<br />
1.9.07<br />
15.9.07<br />
52-Week Price Chart Rel. to KAMCO TRW Index<br />
MUNTAZAHAT KAMCO TRW Index<br />
29.9.07<br />
13.10.07<br />
27.10.07<br />
10.11.07<br />
24.11.07<br />
8.12.07<br />
22.12.07<br />
5.1.08<br />
19.1.08<br />
2.2.08<br />
16.2.08<br />
1.3.08<br />
15.3.08<br />
29.3.08<br />
12.4.08<br />
26.4.08<br />
10.5.08<br />
24.5.08<br />
7.6.08<br />
21.6.08<br />
Index<br />
4,800<br />
4,700<br />
4,600<br />
4,500<br />
4,400<br />
4,300<br />
4,200<br />
4,100<br />
4,000<br />
NA: Not Applicable, NM: Not Meaningful<br />
N/A: Not Available, YTD: Beginning of year to date<br />
#<br />
:Historical P/E, P/B & Yield are based on<br />
current price & historical earning per share,<br />
book value per share & dividend per share<br />
*: The company was listed on the KSE on 21-Jul-07<br />
Investment Research Department<br />
KIPCO Asset Management Co.K.S.C.C<br />
KAMCO<br />
P.O.Box: 28873 Safat 13149 <strong>Kuwait</strong><br />
Email : kamco_research@kamconline.com


