

Kuwait Corporate Fact Sheet
Kuwait Corporate Fact Sheet
Kuwait Corporate Fact Sheet

Create successful ePaper yourself
Turn your PDF publications into a flip-book with our unique Google optimized e-Paper software.
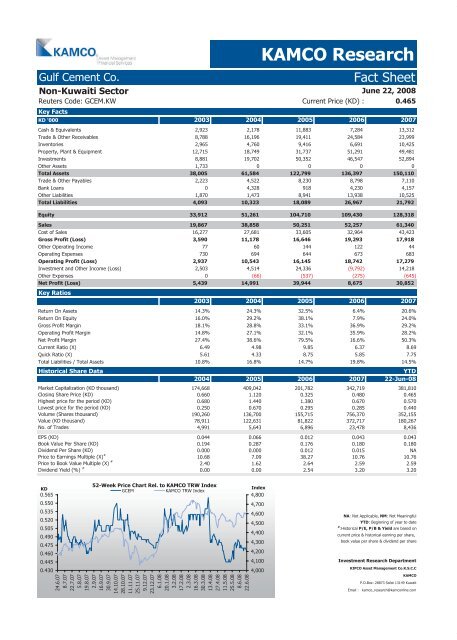
Gulf Cement Co. <strong>Fact</strong> <strong>Sheet</strong><br />
Non-<strong>Kuwait</strong>i Sector<br />
Reuters Code: GCEM.KW Current Price (KD) : 0.465<br />
Key <strong>Fact</strong>s<br />
KAMCO Research<br />
June 22, 2008<br />
KD '000 2003 2004 2005 2006 2007<br />
Cash & Equivalents 2,923 2,178 11,883 7,284 13,312<br />
Trade & Other Receivables 8,788 16,196 19,411 24,584 23,999<br />
Inventories 2,965 4,760 9,416 6,691 10,425<br />
Property, Plant & Equipment 12,715 18,749 31,737 51,291 49,481<br />
Investments 8,881 19,702 50,352 46,547 52,894<br />
Other Assets 1,733 0 0 0 0<br />
Total Assets 38,005 61,584 122,799 136,397 150,110<br />
Trade & Other Payables 2,223 4,522 8,230 8,798 7,110<br />
Bank Loans 0 4,328 918 4,230 4,157<br />
Other Liabilities 1,870 1,473 8,941 13,938 10,525<br />
Total Liabilities 4,093 10,323 18,089 26,967 21,792<br />
Equity 33,912 51,261 104,710 109,430 128,318<br />
Sales 19,867 38,858 50,251 52,257 61,340<br />
Cost of Sales 16,277 27,681 33,605 32,964 43,423<br />
Gross Profit (Loss) 3,590 11,178 16,646 19,293 17,918<br />
Other Operating Income 77 60 144 122 44<br />
Operating Expenses 730 694 644 673 683<br />
Operating Profit (Loss) 2,937 10,543 16,145 18,742 17,279<br />
Investment and Other Income (Loss) 2,503 4,514 24,336 (9,792) 14,218<br />
Other Expenses 0 (66) (537) (275) (645)<br />
Net Profit (Loss)<br />
Key Ratios<br />
5,439 14,991 39,944 8,675 30,852<br />
2003 2004 2005 2006 2007<br />
Return On Assets 14.3% 24.3% 32.5% 6.4% 20.6%<br />
Return On Equity 16.0% 29.2% 38.1% 7.9% 24.0%<br />
Gross Profit Margin 18.1% 28.8% 33.1% 36.9% 29.2%<br />
Operating Profit Margin 14.8% 27.1% 32.1% 35.9% 28.2%<br />
Net Profit Margin 27.4% 38.6% 79.5% 16.6% 50.3%<br />
Current Ratio (X) 6.49 4.98 9.85 6.37 8.69<br />
Quick Ratio (X) 5.61 4.33 8.75 5.85 7.75<br />
Total Liabilities / Total Assets 10.8% 16.8% 14.7% 19.8% 14.5%<br />
Historical Share Data YTD<br />
2004 2005 2006 2007 22-Jun-08<br />
Market Capitalization (KD thousand) 174,668 409,042 201,782 342,719 381,810<br />
Closing Share Price (KD) 0.660 1.120 0.325 0.480 0.465<br />
Highest price for the period (KD) 0.680 1.440 1.380 0.670 0.570<br />
Lowest price for the period (KD) 0.250 0.670 0.295 0.285 0.440<br />
Volume (Shares thousand) 190,260 136,700 155,715 756,370 352,155<br />
Value (KD thousand) 78,911 122,631 81,822 372,717 180,267<br />
No. of Trades 4,991 5,643 6,896 23,478 8,436<br />
EPS (KD) 0.044 0.066 0.012 0.043 0.043<br />
Book Value Per Share (KD) 0.194 0.287 0.176 0.180 0.180<br />
Dividend Per Share (KD) 0.000 0.000 0.012 0.015 NA<br />
Price to Earnings Multiple (X) #<br />
10.68 7.09 38.27 10.76 10.76<br />
Price to Book Value Multiple (X) #<br />
2.40 1.62 2.64 2.59 2.59<br />
Dividend Yield (%) #<br />
0.00 0.00 2.54 3.20 3.20<br />
KD<br />
0.565<br />
0.550<br />
0.535<br />
0.520<br />
0.505<br />
0.490<br />
0.475<br />
0.460<br />
0.445<br />
0.430<br />
52-Week Price Chart Rel. to KAMCO TRW Index<br />
GCEM KAMCO TRW Index<br />
24.6.07<br />
8.7.07<br />
22.7.07<br />
5.8.07<br />
19.8.07<br />
2.9.07<br />
16.9.07<br />
30.9.07<br />
14.10.07<br />
28.10.07<br />
11.11.07<br />
25.11.07<br />
9.12.07<br />
23.12.07<br />
6.1.08<br />
20.1.08<br />
3.2.08<br />
17.2.08<br />
2.3.08<br />
16.3.08<br />
30.3.08<br />
13.4.08<br />
27.4.08<br />
11.5.08<br />
25.5.08<br />
8.6.08<br />
22.6.08<br />
Index<br />
4,800<br />
4,700<br />
4,600<br />
4,500<br />
4,400<br />
4,300<br />
4,200<br />
4,100<br />
4,000<br />
NA: Not Applicable, NM: Not Meaningful<br />
YTD: Beginning of year to date<br />
#<br />
:Historical P/E, P/B & Yield are based on<br />
current price & historical earning per share,<br />
book value per share & dividend per share<br />
Investment Research Department<br />
KIPCO Asset Management Co.K.S.C.C<br />
KAMCO<br />
P.O.Box: 28873 Safat 13149 <strong>Kuwait</strong><br />
Email : kamco_research@kamconline.com


