United Gulf Bank <strong>Fact</strong> <strong>Sheet</strong> Non-<strong>Kuwait</strong>i Sector Reuters Code: UGBK.KW Current Price (KD) : 0.540 Key <strong>Fact</strong>s KAMCO Research June 22, 2008 KD ' 000 2003 2004 2005 2006 2007 Demand & Time Deposits with Banks 90,112 99,465 111,603 146,411 147,725 Loans & Advances 41,729 48,047 52,236 89,136 79,913 Held for Trading Investments 35,818 50,966 55,875 99,464 97,601 Available For Sale Investments 79,511 99,840 131,161 152,218 154,743 Investment In Associates 76,527 92,403 115,448 167,675 216,402 Other Long-term Investments 5,704 4,148 4,240 5,103 7,342 Property & equipment 1,428 1,700 1,607 2,016 3,161 Other Assets 19,120 12,473 20,413 17,668 23,511 Total Assets 349,949 409,042 492,582 679,691 730,398 Deposits from Banks & Financial Institutions 98,816 135,971 146,629 209,199 160,634 Customer Deposits 63,375 78,610 68,550 113,242 119,955 Bonds 17,682 36,314 36,077 35,903 19,806 Loans 66,236 49,775 89,885 105,941 158,133 Other Liabilities 10,802 10,977 13,576 43,989 51,533 Total Liabilities 256,911 311,647 354,717 508,274 510,061 Minority Interest 16,336 14,961 27,974 29,981 39,149 Equity 76,702 82,434 109,891 141,436 181,189 Investment Income 13,597 10,020 22,838 27,898 54,786 Interest Income 3,090 4,003 6,581 9,977 12,628 Share of Profits in Associated Companies 8,206 9,585 14,474 15,483 29,278 Fees & Commissions and FX Revaluation Gains 8,247 7,584 14,148 16,565 24,121 Total Income 33,140 31,191 58,041 69,923 120,813 Interest Expense 5,000 6,516 11,191 19,102 22,327 Operating Expenses 8,287 8,602 12,650 15,432 20,614 Other Non-operating Expenses 9,174 3,309 10,546 6,050 17,402 Net Profit Key Ratios 10,679 12,764 23,653 29,338 60,470 2003 2004 2005 2006 2007 Return On Average Assets 3.4% 3.4% 5.2% 5.0% 8.6% Return On Average Equity 15.3% 16.0% 24.6% 23.3% 37.5% Cost / Income Ratio 27.7% 34.9% 27.0% 30.4% 20.9% Net Profit Growth 251.0% 19.5% 85.3% 24.0% 106.1% Investments / Total Assets 56.5% 60.5% 62.3% 62.4% 65.2% Net Loans / Customer Deposits 65.8% 61.1% 76.2% 78.7% 66.6% Historical Share Data YTD 2004 2005 2006 2007 22-Jun-08 Market Capitalization (KD thousand) 134,400 248,141 236,621 374,895 440,094 Closing Share Price (KD) 0.168 0.310 0.295 0.460 0.540 Highest Price for the Period (KD) 0.206 0.355 0.365 0.470 0.670 Lowest Price for the Period (KD) 0.144 0.156 0.190 0.275 0.445 Volume (Shares thousand) 470,460 562,080 541,230 491,180 266,240 Value (KD thousand) 81,530 121,864 146,896 181,793 149,558 No. of Trades 8,609 12,266 14,122 14,122 7,546 EPS (KD) 0.017 0.030 0.037 0.075 0.075 Book Value Per Share (KD) 0.108 0.137 0.177 0.223 0.223 Dividend Per Share (KD) 0.011 0.020 0.025 0.045 NA Price to Earnings Multiple (X) # 32.32 17.73 14.58 7.23 7.23 Price to Book Value Multiple (X) # 5.01 3.93 3.06 2.43 2.43 Dividend Yield (%) # 2.06 3.72 4.63 8.24 8.24 KD 0.680 0.630 0.580 0.530 0.480 0.430 0.380 52-Week Price Chart Rel. to KAMCO TRW Index UGB KAMCO TRW Index 24.6.07 8.7.07 22.7.07 5.8.07 19.8.07 2.9.07 16.9.07 30.9.07 14.10.07 28.10.07 11.11.07 25.11.07 9.12.07 23.12.07 6.1.08 20.1.08 3.2.08 17.2.08 2.3.08 16.3.08 30.3.08 13.4.08 27.4.08 11.5.08 25.5.08 8.6.08 22.6.08 Index 4,800 4,700 4,600 4,500 4,400 4,300 4,200 4,100 4,000 NA: Not Applicable, NM: Not Meaningful YTD: Beginning of year to date # :Historical P/E, P/B & Yield are based on current price & historical earning per share, book value per share & dividend per share Investment Research Department KIPCO Asset Management Co.K.S.C.C KAMCO P.O.Box: 28873 Safat 13149 <strong>Kuwait</strong> Email : kamco_research@kamconline.com
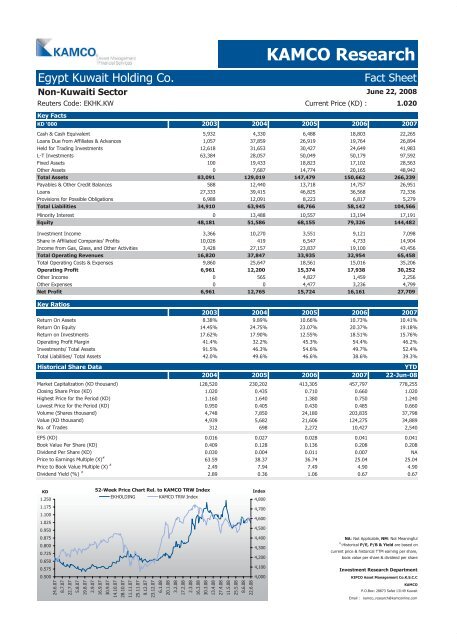
Egypt <strong>Kuwait</strong> Holding Co. <strong>Fact</strong> <strong>Sheet</strong> Non-<strong>Kuwait</strong>i Sector Reuters Code: EKHK.KW Current Price (KD) : 1.020 Key <strong>Fact</strong>s KAMCO Research June 22, 2008 KD '000 2003 2004 2005 2006 2007 Cash & Cash Equivalent 5,932 4,330 6,488 18,803 22,265 Loans Due from Affiliates & Advances 1,057 37,859 26,919 19,764 26,894 Held for Trading Investments 12,618 31,653 30,427 24,649 41,983 L-T Investments 63,384 28,057 50,049 50,179 97,592 Fixed Assets 100 19,433 18,823 17,102 28,563 Other Assets 0 7,687 14,774 20,165 48,942 Total Assets 83,091 129,019 147,479 150,662 266,239 Payables & Other Credit Balances 588 12,440 13,718 14,757 26,951 Loans 27,333 39,415 46,825 36,568 72,336 Provisions for Possible Obligations 6,988 12,091 8,223 6,817 5,279 Total Liabilities 34,910 63,945 68,766 58,142 104,566 Minority Interest 0 13,488 10,557 13,194 17,191 Equity 48,181 51,586 68,155 79,326 144,482 Investment Income 3,366 10,270 3,551 9,121 7,098 Share in Affiliated Companies' Profits 10,026 419 6,547 4,733 14,904 Income from Gas, Glass, and Other Activities 3,428 27,157 23,837 19,100 43,456 Total Operating Revenues 16,820 37,847 33,935 32,954 65,458 Total Operating Costs & Expenses 9,860 25,647 18,561 15,016 35,206 Operating Profit 6,961 12,200 15,374 17,938 30,252 Other Income 0 565 4,827 1,459 2,256 Other Expenses 0 0 4,477 3,236 4,799 Net Profit 6,961 12,765 15,724 16,161 27,709 Key Ratios 2003 2004 2005 2006 2007 Return On Assets 8.38% 9.89% 10.66% 10.73% 10.41% Return On Equity 14.45% 24.75% 23.07% 20.37% 19.18% Return on Investments 17.62% 17.90% 12.55% 18.51% 15.76% Operating Profit Margin 41.4% 32.2% 45.3% 54.4% 46.2% Investments/ Total Assets 91.5% 46.3% 54.6% 49.7% 52.4% Total Liabilities/ Total Assets 42.0% 49.6% 46.6% 38.6% 39.3% Historical Share Data YTD 2004 2005 2006 2007 22-Jun-08 Market Capitalization (KD thousand) 128,520 230,202 413,305 457,797 778,255 Closing Share Price (KD) 1.020 0.435 0.710 0.660 1.020 Highest Price for the Period (KD) 1.160 1.640 1.380 0.750 1.240 Lowest Price for the Period (KD) 0.950 0.405 0.430 0.485 0.660 Volume (Shares thousand) 4,748 7,850 24,180 203,835 37,798 Value (KD thousand) 4,939 5,682 21,606 124,275 34,889 No. of Trades 312 698 2,272 10,427 2,540 EPS (KD) 0.016 0.027 0.028 0.041 0.041 Book Value Per Share (KD) 0.409 0.128 0.136 0.208 0.208 Dividend Per Share (KD) 0.030 0.004 0.011 0.007 NA Price to Earnings Multiple (X) # 63.59 38.37 36.74 25.04 25.04 Price to Book Value Multiple (X) # 2.49 7.94 7.49 4.90 4.90 Dividend Yield (%) # 2.89 0.36 1.06 0.67 0.67 KD 1.250 1.175 1.100 1.025 0.950 0.875 0.800 0.725 0.650 0.575 0.500 24.6.07 8.7.07 22.7.07 5.8.07 19.8.07 2.9.07 52-Week Price Chart Rel. to KAMCO TRW Index 16.9.07 30.9.07 EKHOLDING KAMCO TRW Index 14.10.07 28.10.07 11.11.07 25.11.07 9.12.07 23.12.07 6.1.08 20.1.08 3.2.08 17.2.08 2.3.08 16.3.08 30.3.08 13.4.08 27.4.08 11.5.08 25.5.08 8.6.08 22.6.08 Index 4,800 4,700 4,600 4,500 4,400 4,300 4,200 4,100 4,000 NA: Not Applicable, NM: Not Meaningful # :Historical P/E, P/B & Yield are based on current price & historical TTM earning per share, book value per share & dividend per share Investment Research Department KIPCO Asset Management Co.K.S.C.C KAMCO P.O.Box: 28873 Safat 13149 <strong>Kuwait</strong> Email : kamco_research@kamconline.com
- Page 1:
July 2008 Kuwait Stock Exchange Cor
- Page 4 and 5:
KAMCO Profile Overview KIPCO Asset
- Page 6 and 7:
B. The Bond & High Yield Fund (BHYF
- Page 9:
Banking Sector Fact Sheet Reuters C
- Page 12 and 13:
Gulf Bank Fact Sheet Banking Sector
- Page 14 and 15:
Ahli Bank of Kuwait Fact Sheet Bank
- Page 16 and 17:
Kuwait International Bank Fact Shee
- Page 18 and 19:
Kuwait Finance House Fact Sheet Ban
- Page 21:
Investment Sector Fact Sheet June 2
- Page 24 and 25:
Commercial Facilities Co. Fact Shee
- Page 26 and 27:
National Investment Co. Fact Sheet
- Page 28 and 29:
Al-Ahlia Holding Co. Fact Sheet Inv
- Page 30 and 31:
The International Investor Co. Fact
- Page 32 and 33:
Industrial Investment Co. Investmen
- Page 34 and 35:
International Finance Co. Fact Shee
- Page 36 and 37:
Kuwait & Middle East Financial Inv.
- Page 38 and 39:
AREF Investment Group Fact Sheet In
- Page 40 and 41:
Al Aman Investment Co. Fact Sheet I
- Page 42 and 43:
Al-Mal Investment Co. Fact Sheet In
- Page 44 and 45:
A'ayan Leasing & Investment Co. Fac
- Page 46 and 47:
Global Investment House Co. Fact Sh
- Page 48 and 49:
Gulfinvest International Co. Fact S
- Page 50 and 51:
KIPCO Asset Management Co. Fact She
- Page 52 and 53:
Kuwait Invest Holding Co. Fact Shee
- Page 54 and 55:
Housing Finance Co. Fact Sheet Inve
- Page 56 and 57:
Al-Deera Holding Co. Fact Sheet Inv
- Page 58 and 59:
Burgan Group Holding Co. Fact Sheet
- Page 60 and 61:
Al-Qurain Holding Co. Fact Sheet In
- Page 62 and 63:
Al-Madina for Finance and Investmen
- Page 64 and 65:
Tamdeen Investment Co. Fact Sheet I
- Page 66 and 67:
DAMAC Kuwaiti Holding Co. Fact Shee
- Page 69:
Insurance Sector Fact Sheet Reuters
- Page 72 and 73:
Gulf Insurance Co. Fact Sheet Insur
- Page 74 and 75:
Warba Insurance Co. Fact Sheet Insu
- Page 76 and 77:
First Takaful Insurance Co. Fact Sh
- Page 79:
Real Estate Sector Fact Sheet June
- Page 82 and 83:
United Real Estate Co. Real Estate
- Page 84 and 85:
Salhia Real Estate Co. Real Estate
- Page 86 and 87:
Tamdeen Real Estate Co. Fact Sheet
- Page 88 and 89:
Ajial Real Estate Entertainment Co.
- Page 90 and 91:
Arab Real Estate Co. Fact Sheet Rea
- Page 92 and 93:
Al-Enma'a Real Estate Co. Fact Shee
- Page 94 and 95:
Injazzat Real Estate Development Co
- Page 96 and 97:
Investors Holding Group Co. Fact Sh
- Page 98 and 99:
The Commercial Real Estate Co. Fact
- Page 100 and 101:
A'ayan Real Estate Co. Fact Sheet R
- Page 102 and 103:
Kuwait Real Estate Holding Co. Fact
- Page 104 and 105:
Al-Dar National Real Estate Co. Fac
- Page 106 and 107:
Grand Real Estate Projects Co. Fact
- Page 108 and 109:
Tameer Real Estate Investment Co. F
- Page 110 and 111:
Safat Global Holding Co. Fact Sheet
- Page 112 and 113:
Abyaar Real Estate Development Co.
- Page 114:
First Dubai Real Estate Development
- Page 118 and 119:
National Industries Group Holding F
- Page 120 and 121:
Kuwait Cement Co. Fact Sheet Indust
- Page 122 and 123:
Gulf Cable & Electrical Industries
- Page 124 and 125:
Contracting & Marine Services Co. F
- Page 126 and 127:
Shuaiba Paper Products Co. Fact She
- Page 128 and 129:
Kuwait Foundry Co. Fact Sheet Indus
- Page 130 and 131:
United Industries Co. Fact Sheet In
- Page 132 and 133:
Gulf Glass Manufacturing Co. Fact S
- Page 134 and 135:
Al-Kout Industrial Projects Co. Fac
- Page 136 and 137:
Kuwait Building Materials Manufactu
- Page 138 and 139:
Gulf Rocks Co. Fact Sheet Industria
- Page 140 and 141:
Mena Holding Group Fact Sheet Indus
- Page 142 and 143:
Kuwait Gypsum Manufacturing & Tradi
- Page 144 and 145:
Salbookh Trading Co. Fact Sheet Ind
- Page 147:
Services Sector Fact Sheet Reuters
- Page 150 and 151:
Kuwait Hotels Co. Fact Sheet Servic
- Page 152 and 153:
Kuwait Commercial Complex Co. Fact
- Page 154 and 155:
Hasibat Holding Co. Fact Sheet Serv
- Page 156 and 157:
Independent Petroleum Group Fact Sh
- Page 158 and 159:
Sultan Center Food Products Co. Fac
- Page 160 and 161:
The Transport & Warehousing Group C
- Page 162 and 163:
Kuwait & Gulf Link Transport Co. Fa
- Page 164 and 165:
Automated Systems Co. Fact Sheet Se
- Page 166 and 167:
Kuwait Co. For Process Plant Const.
- Page 168 and 169:
Eyas for Higher & Technical Educati
- Page 170 and 171:
Al Safwa Group Holding Co.* Fact Sh
- Page 172 and 173: Privatization Holding Co. Fact Shee
- Page 174 and 175: National Slaughter House Co. Fact S
- Page 176 and 177: Safwan Trading & Contracting Co. Fa
- Page 178 and 179: Gulf Franchising Holding Co. Fact S
- Page 180 and 181: National Ranges Co. Fact Sheet Serv
- Page 182 and 183: IFA Hotels & Resorts Co. Fact Sheet
- Page 184 and 185: Jeeran Holding Co. Fact Sheet Servi
- Page 186 and 187: Al Safat Tec Holding Company Fact S
- Page 188 and 189: United Projects Group Fact Sheet Se
- Page 190 and 191: Aviation Lease & Finance Co. Fact S
- Page 192 and 193: Haj & Umrah Services Consortium (Ma
- Page 194 and 195: Villa Moda Lifestyle Co. Fact Sheet
- Page 196 and 197: Network Holding Co. Services Sector
- Page 198 and 199: Mubarrad Transport Co. Fact Sheet S
- Page 200 and 201: Advanced Technology Co. Fact Sheet
- Page 202: Jazeera Airways Co. Fact Sheet Serv
- Page 206 and 207: Livestock & Transport Trading Co. F
- Page 208 and 209: Kuwait United Poultry Co. Fact Shee
- Page 210 and 211: United Foodstuff Industries Group C
- Page 213: Non-Kuwaiti Sector Fact Sheet Reute
- Page 216 and 217: Sharjah Cement & Industries Dev. Co
- Page 218 and 219: Umm Al-Qaiwain Cement Industries Co
- Page 220 and 221: Ras Al-Khaimah Co. For White Cement
- Page 224 and 225: Bahrain Kuwait Insurance Co. Fact S
- Page 226 and 227: Commercial International Bank Fact
- Page 228 and 229: Ahli United Bank Fact Sheet Non-Kuw
- Page 230: Ithmaar Bank Fact Sheet Non-Kuwaiti