

Kuwait Corporate Fact Sheet
Kuwait Corporate Fact Sheet
Kuwait Corporate Fact Sheet

Create successful ePaper yourself
Turn your PDF publications into a flip-book with our unique Google optimized e-Paper software.
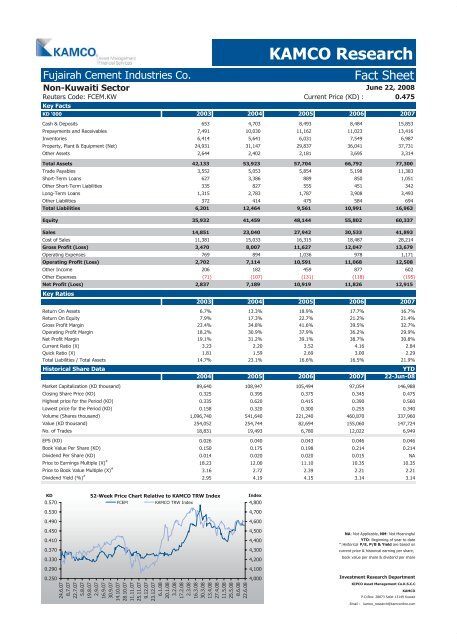
Fujairah Cement Industries Co. <strong>Fact</strong> <strong>Sheet</strong><br />
Non-<strong>Kuwait</strong>i Sector<br />
Reuters Code: FCEM.KW Current Price (KD) :<br />
June 22, 2008<br />
0.475<br />
Key <strong>Fact</strong>s<br />
KAMCO Research<br />
KD '000 2003 2004 2005 2006 2007<br />
Cash & Deposits 653 4,703 8,493 8,484 15,853<br />
Prepayments and Receivables 7,491 10,030 11,162 11,023 13,416<br />
Inventories 6,414 5,641 6,031 7,549 6,987<br />
Property, Plant & Equipment (Net) 24,931 31,147 29,837 36,041 37,731<br />
Other Assets 2,644 2,402 2,181 3,695 3,314<br />
Total Assets 42,133 53,923 57,704 66,792 77,300<br />
Trade Payables 3,552 5,053 5,854 5,198 11,383<br />
Short-Term Loans 627 3,386 889 850 1,051<br />
Other Short-Term Liabilities 335 827 555 451 342<br />
Long-Term Loans 1,315 2,783 1,787 3,908 3,493<br />
Other Liabilities 372 414 475 584 694<br />
Total Liabilities 6,201 12,464 9,561 10,991 16,963<br />
Equity 35,932 41,459 48,144 55,802 60,337<br />
Sales 14,851 23,040 27,942 30,533 41,893<br />
Cost of Sales 11,381 15,033 16,315 18,487 28,214<br />
Gross Profit (Loss) 3,470 8,007 11,627 12,047 13,679<br />
Operating Expenses 769 894 1,036 978 1,171<br />
Operating Profit (Loss) 2,702 7,114 10,591 11,068 12,508<br />
Other Income 206 182 459 877 602<br />
Other Expenses (71) (107) (131) (118) (195)<br />
Net Profit (Loss)<br />
Key Ratios<br />
2,837 7,189 10,919 11,826 12,915<br />
2003 2004 2005 2006 2007<br />
Return On Assets 6.7% 13.3% 18.9% 17.7% 16.7%<br />
Return On Equity 7.9% 17.3% 22.7% 21.2% 21.4%<br />
Gross Profit Margin 23.4% 34.8% 41.6% 39.5% 32.7%<br />
Operating Profit Margin 18.2% 30.9% 37.9% 36.2% 29.9%<br />
Net Profit Margin 19.1% 31.2% 39.1% 38.7% 30.8%<br />
Current Ratio (X) 3.23 2.20 3.52 4.16 2.84<br />
Quick Ratio (X) 1.81 1.59 2.69 3.00 2.29<br />
Total Liabilities / Total Assets 14.7% 23.1% 16.6% 16.5% 21.9%<br />
Historical Share Data YTD<br />
2004 2005 2006 2007 22-Jun-08<br />
Market Capitalization (KD thousand) 89,640 108,947 105,494 97,054 146,988<br />
Closing Share Price (KD) 0.325 0.395 0.375 0.345 0.475<br />
Highest price for the Period (KD) 0.335 0.620 0.415 0.390 0.560<br />
Lowest price for the Period (KD) 0.158 0.320 0.300 0.255 0.340<br />
Volume (Shares thousand) 1,096,740 541,640 221,240 460,870 337,960<br />
Value (KD thousand) 254,052 254,744 82,694 155,060 147,724<br />
No. of Trades 18,831 19,493 6,780 12,022 6,949<br />
EPS (KD) 0.026 0.040 0.043 0.046 0.046<br />
Book Value Per Share (KD) 0.150 0.175 0.198 0.214 0.214<br />
Dividend Per Share (KD) 0.014 0.020 0.020 0.015 NA<br />
Price to Earnings Multiple (X) #<br />
18.23 12.00 11.10 10.35 10.35<br />
Price to Book Value Multiple (X) #<br />
3.16 2.72 2.39 2.21 2.21<br />
Dividend Yield (%) #<br />
2.95 4.19 4.15 3.14 3.14<br />
KD<br />
0.570<br />
0.530<br />
0.490<br />
0.450<br />
0.410<br />
0.370<br />
0.330<br />
0.290<br />
0.250<br />
52-Week Price Chart Relative to KAMCO TRW Index<br />
FCEM KAMCO TRW Index<br />
24.6.07<br />
8.7.07<br />
22.7.07<br />
5.8.07<br />
19.8.07<br />
2.9.07<br />
16.9.07<br />
30.9.07<br />
14.10.07<br />
28.10.07<br />
11.11.07<br />
25.11.07<br />
9.12.07<br />
23.12.07<br />
6.1.08<br />
20.1.08<br />
3.2.08<br />
17.2.08<br />
2.3.08<br />
16.3.08<br />
30.3.08<br />
13.4.08<br />
27.4.08<br />
11.5.08<br />
25.5.08<br />
8.6.08<br />
22.6.08<br />
Index<br />
4,800<br />
4,700<br />
4,600<br />
4,500<br />
4,400<br />
4,300<br />
4,200<br />
4,100<br />
4,000<br />
NA: Not Applicable, NM: Not Meaningful<br />
YTD: Beginning of year to date<br />
#<br />
:Historical P/E, P/B&Yield are based on<br />
current price & historical earning per share,<br />
book value per share & dividend per share<br />
Investment Research Department<br />
KIPCO Asset Management Co.K.S.C.C<br />
KAMCO<br />
P.O.Box: 28873 Safat 13149 <strong>Kuwait</strong><br />
Email : kamco_research@kamconline.com


