

Kuwait Corporate Fact Sheet
Kuwait Corporate Fact Sheet
Kuwait Corporate Fact Sheet

Create successful ePaper yourself
Turn your PDF publications into a flip-book with our unique Google optimized e-Paper software.
National Petroleum Services Co. <strong>Fact</strong> <strong>Sheet</strong><br />
Services Sector<br />
Reuters Code: NAPS.KW Current Price (KD) : 0.355<br />
Key <strong>Fact</strong>s<br />
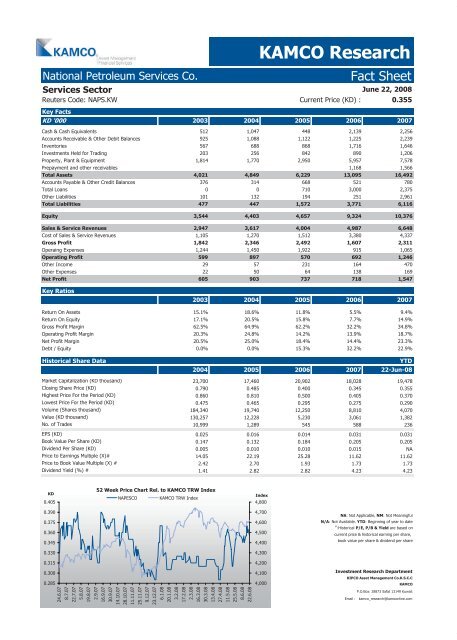
KD '000 2003 2004 2005 2006 2007<br />
Cash & Cash Equivalents 512 1,047 448 2,139 2,256<br />
Accounts Receivable & Other Debit Balances 925 1,088 1,122 1,225 2,239<br />
Inventories 567 688 868 1,716 1,646<br />
Investments Held for Trading 203 256 842 890 1,206<br />
Property, Plant & Equipment 1,814 1,770 2,950 5,957 7,578<br />
Prepayment and other receivables 1,168 1,566<br />
Total Assets 4,021 4,849 6,229 13,095 16,492<br />
Accounts Payable & Other Credit Balances 376 314 668 521 780<br />
Total Loans 0 0 710 3,000 2,375<br />
Other Liabilities 101 132 194 251 2,961<br />
Total Liabilities 477 447 1,572 3,771 6,116<br />
Equity 3,544 4,403 4,657 9,324 10,376<br />
Sales & Service Revenues 2,947 3,617 4,004 4,987 6,648<br />
Cost of Sales & Service Revenues 1,105 1,270 1,512 3,380 4,337<br />
Gross Profit 1,842 2,346 2,492 1,607 2,311<br />
Operaing Expenses 1,244 1,450 1,922 915 1,065<br />
Operating Profit 599 897 570 692 1,246<br />
Other Income 29 57 231 164 470<br />
Other Expenses 22 50 64 138 169<br />
Net Profit 605 903 737 718 1,547<br />
Key Ratios<br />
KAMCO Research<br />
June 22, 2008<br />
2003 2004 2005 2006 2007<br />
Return On Assets 15.1% 18.6% 11.8% 5.5% 9.4%<br />
Return On Equity 17.1% 20.5% 15.8% 7.7% 14.9%<br />
Gross Profit Margin 62.5% 64.9% 62.2% 32.2% 34.8%<br />
Operating Profit Margin 20.3% 24.8% 14.2% 13.9% 18.7%<br />
Net Profit Margin 20.5% 25.0% 18.4% 14.4% 23.3%<br />
Debt / Equity 0.0% 0.0% 15.3% 32.2% 22.9%<br />
Historical Share Data YTD<br />
2004 2005 2006 2007 22-Jun-08<br />
Market Capitalization (KD thousand) 23,700 17,460 20,902 18,028 19,478<br />
Closing Share Price (KD) 0.790 0.485 0.400 0.345 0.355<br />
Highest Price For the Period (KD) 0.860 0.810 0.500 0.405 0.370<br />
Lowest Price For the Period (KD) 0.475 0.465 0.295 0.275 0.290<br />
Volume (Shares thousand) 184,340 19,740 12,250 8,810 4,070<br />
Value (KD thousand) 130,257 12,228 5,230 3,061 1,382<br />
No. of Trades 10,999 1,289 545 588 236<br />
EPS (KD) 0.025 0.016 0.014 0.031 0.031<br />
Book Value Per Share (KD) 0.147 0.132 0.184 0.205 0.205<br />
Dividend Per Share (KD) 0.005 0.010 0.010 0.015 NA<br />
Price to Earnings Multiple (X)# 14.05 22.19 25.28 11.62 11.62<br />
Price to Book Value Multiple (X) # 2.42 2.70 1.93 1.73 1.73<br />
Dividend Yield (%) # 1.41 2.82 2.82 4.23 4.23<br />
KD<br />
0.405<br />
0.390<br />
0.375<br />
0.360<br />
0.345<br />
0.330<br />
0.315<br />
0.300<br />
0.285<br />
52 Week Price Chart Rel. to KAMCO TRW Index<br />
NAPESCO KAMCO TRW Index<br />
24.6.07<br />
8.7.07<br />
22.7.07<br />
5.8.07<br />
19.8.07<br />
2.9.07<br />
16.9.07<br />
30.9.07<br />
14.10.07<br />
28.10.07<br />
11.11.07<br />
25.11.07<br />
9.12.07<br />
23.12.07<br />
6.1.08<br />
20.1.08<br />
3.2.08<br />
17.2.08<br />
2.3.08<br />
16.3.08<br />
30.3.08<br />
13.4.08<br />
27.4.08<br />
11.5.08<br />
25.5.08<br />
8.6.08<br />
22.6.08<br />
Index<br />
4,800<br />
4,700<br />
4,600<br />
4,500<br />
4,400<br />
4,300<br />
4,200<br />
4,100<br />
4,000<br />
NA: Not Applicable, NM: Not Meaningful<br />
N/A: Not Available. YTD: Beginning of year to date<br />
#<br />
:Historical P/E, P/B & Yield are based on<br />
current price & historical earning per share,<br />
book value per share & dividend per share<br />
Investment Research Department<br />
KIPCO Asset Management Co.K.S.C.C<br />
KAMCO<br />
P.O.Box: 28873 Safat 13149 <strong>Kuwait</strong><br />
Email : kamco_research@kamconline.com


