

Kuwait Corporate Fact Sheet
Kuwait Corporate Fact Sheet
Kuwait Corporate Fact Sheet

Create successful ePaper yourself
Turn your PDF publications into a flip-book with our unique Google optimized e-Paper software.
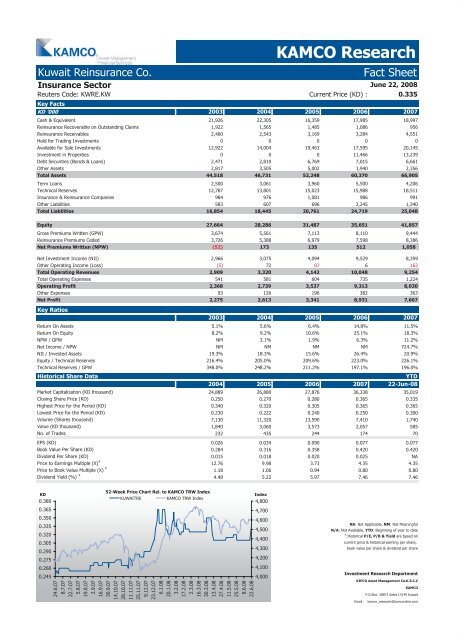
<strong>Kuwait</strong> Reinsurance Co. <strong>Fact</strong> <strong>Sheet</strong><br />
Insurance Sector<br />
KAMCO Research<br />
June 22, 2008<br />
Reuters Code: KWRE.KW Current Price (KD) : 0.335<br />
Key <strong>Fact</strong>s<br />
KD '000 2003 2004 2005 2006 2007<br />
Cash & Equivalent 21,926 22,305 16,359 17,985 18,997<br />
Reinsurance Recoverable on Outstanding Claims 1,922 1,565 1,485 1,086 956<br />
Reinsurance Receivables 2,460 2,543 3,169 3,284 4,551<br />
Held for Trading Investments 0 0 0 0 0<br />
Available for Sale Investments 12,922 14,004 19,463 17,595 20,145<br />
Investment in Properties 0 0 0 11,466 13,239<br />
Debt Securities (Bonds & Loans) 2,471 2,810 6,769 7,015 6,661<br />
Other Assets 2,817 3,505 5,002 1,940 2,356<br />
Total Assets 44,518 46,731 52,248 60,370 66,905<br />
Term Loans 2,500 3,061 3,960 5,500 4,206<br />
Technical Reserves 12,787 13,801 15,023 15,988 18,511<br />
Insurance & Reinsurance Companies 984 976 1,081 986 991<br />
Other Liabilities 583 607 696 2,245 1,340<br />
Total Liabilities 16,854 18,445 20,761 24,719 25,048<br />
Equity 27,664 28,286 31,487 35,651 41,857<br />
Gross Premiums Written (GPW) 3,674 5,561 7,113 8,110 9,444<br />
Reinsurance Premiums Ceded 3,726 5,388 6,979 7,598 8,386<br />
Net Premiums Written (NPW) (52) 173 135 512 1,058<br />
Net Investment Income (NII) 2,966 3,075 4,094 9,529 8,359<br />
Other Operating Income (Loss) (5) 72 87 6 163<br />
Total Operating Revenues 2,909 3,320 4,142 10,048 9,254<br />
Total Operating Expenses 541 581 604 735 1,224<br />
Operating Profit 2,368 2,739 3,537 9,313 8,030<br />
Other Expenses 93 126 196 382 363<br />
Net Profit 2,275 2,613 3,341 8,931 7,667<br />
Key Ratios<br />
2003 2004 2005 2006 2007<br />
Return On Assets 5.1% 5.6% 6.4% 14.8% 11.5%<br />
Return On Equity 8.2% 9.2% 10.6% 25.1% 18.3%<br />
NPW / GPW NM 3.1% 1.9% 6.3% 11.2%<br />
Net Income / NPW NM NM NM NM 724.7%<br />
NII / Invested Assets 19.3% 18.3% 15.6% 26.4% 20.9%<br />
Equity / Technical Reserves 216.4% 205.0% 209.6% 223.0% 226.1%<br />
Technical Reserves / GPW 348.0% 248.2% 211.2% 197.1% 196.0%<br />
Historical Share Data YTD<br />
2004 2005 2006 2007 22-Jun-08<br />
Market Capitalization (KD thousand) 24,889 26,880 27,876 36,338 35,019<br />
Closing Share Price (KD) 0.250 0.270 0.280 0.365 0.335<br />
Highest Price for the Period (KD) 0.340 0.320 0.305 0.365 0.365<br />
Lowest Price for the Period (KD) 0.230 0.222 0.240 0.250 0.300<br />
Volume (Shares thousand) 7,130 11,320 13,590 7,410 1,740<br />
Value (KD thousand) 1,840 3,060 3,573 2,057 585<br />
No. of Trades 232 435 244 174 70<br />
EPS (KD) 0.026 0.034 0.090 0.077 0.077<br />
Book Value Per Share (KD) 0.284 0.316 0.358 0.420 0.420<br />
Dividend Per Share (KD) 0.015 0.018 0.020 0.025 NA<br />
Price to Earnings Multiple (X) #<br />
12.76 9.98 3.73 4.35 4.35<br />
Price to Book Value Multiple (X) #<br />
1.18 1.06 0.94 0.80 0.80<br />
Dividend Yield (%) #<br />
4.48 5.22 5.97 7.46 7.46<br />
KD<br />
0.380<br />
0.365<br />
0.350<br />
0.335<br />
0.320<br />
0.305<br />
0.290<br />
0.275<br />
0.260<br />
0.245<br />
52-Week Price Chart Rel. to KAMCO TRW Index<br />
KUWAITRE KAMCO TRW Index<br />
24.6.07<br />
8.7.07<br />
22.7.07<br />
5.8.07<br />
19.8.07<br />
2.9.07<br />
16.9.07<br />
30.9.07<br />
14.10.07<br />
28.10.07<br />
11.11.07<br />
25.11.07<br />
9.12.07<br />
23.12.07<br />
6.1.08<br />
20.1.08<br />
3.2.08<br />
17.2.08<br />
2.3.08<br />
16.3.08<br />
30.3.08<br />
13.4.08<br />
27.4.08<br />
11.5.08<br />
25.5.08<br />
8.6.08<br />
22.6.08<br />
Index<br />
4,800<br />
4,700<br />
4,600<br />
4,500<br />
4,400<br />
4,300<br />
4,200<br />
4,100<br />
4,000<br />
NA: Not Applicable, NM: Not Meaningful<br />
N/A: Not Available, YTD: Beginning of year to date<br />
#<br />
:Historical P/E, P/B & Yield are based on<br />
current price & historical earning per share,<br />
book value per share & dividend per share<br />
Investment Research Department<br />
KIPCO Asset Management Co.K.S.C.C<br />
KAMCO<br />
P.O.Box: 28873 Safat 13149 <strong>Kuwait</strong><br />
Email : kamco_research@kamconline.com


