

Kuwait Corporate Fact Sheet
Kuwait Corporate Fact Sheet
Kuwait Corporate Fact Sheet

You also want an ePaper? Increase the reach of your titles
YUMPU automatically turns print PDFs into web optimized ePapers that Google loves.
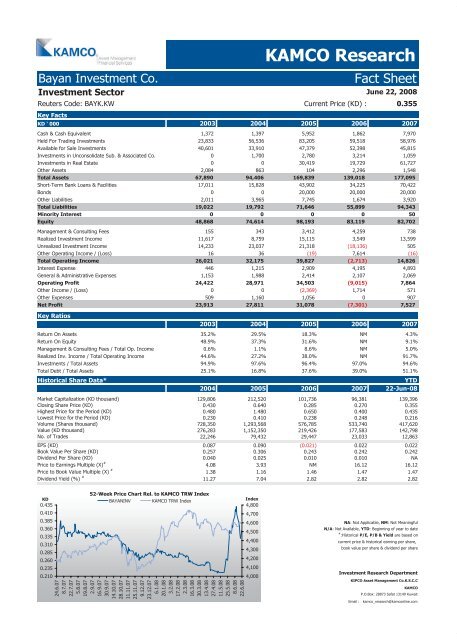
Bayan Investment Co. <strong>Fact</strong> <strong>Sheet</strong><br />
Investment Sector<br />
Reuters Code: BAYK.KW Current Price (KD) : 0.355<br />
Key <strong>Fact</strong>s<br />
KD ' 000 2003 2004 2005 2006 2007<br />
Cash & Cash Equivalent 1,372 1,397 5,952 1,862 7,970<br />
Held For Trading Investments 23,833 56,536 83,205 59,518 58,976<br />
Available for Sale Investments 40,601 33,910 47,379 52,398 45,815<br />
Investments in Unconsolidate Sub. & Associated Co. 0 1,700 2,780 3,214 1,059<br />
Investments in Real Estate 0 0 30,419 19,729 61,727<br />
Other Assets 2,084 863 104 2,296 1,548<br />
Total Assets 67,890 94,406 169,839 139,018 177,095<br />
Short-Term Bank Loans & Facilities 17,011 15,828 43,902 34,225 70,422<br />
Bonds 0 0 20,000 20,000 20,000<br />
Other Liabilities 2,011 3,965 7,745 1,674 3,920<br />
Total Liabilities 19,022 19,792 71,646 55,899 94,343<br />
Minority Interest 0 0 0 0 50<br />
Equity 48,868 74,614 98,193 83,119 82,702<br />
Management & Consulting Fees 155 343 3,412 4,259 738<br />
Realized Investment Income 11,617 8,759 15,115 3,549 13,599<br />
Unrealized Investment Income 14,233 23,037 21,318 (18,136) 505<br />
Other Operating Income / (Loss) 16 36 (19) 7,614 (16)<br />
Total Operating Income 26,021 32,175 39,827 (2,713) 14,826<br />
Interest Expense 446 1,215 2,909 4,195 4,893<br />
General & Administrative Expenses 1,153 1,988 2,414 2,107 2,069<br />
Operating Profit 24,422 28,971 34,503 (9,015) 7,864<br />
Other Income / (Loss) 0 0 (2,369) 1,714 571<br />
Other Expenses 509 1,160 1,056 0 907<br />
Net Profit 23,913 27,811 31,078 (7,301) 7,527<br />
Key Ratios<br />
KAMCO Research<br />
June 22, 2008<br />
2003 2004 2005 2006 2007<br />
Return On Assets 35.2% 29.5% 18.3% NM 4.3%<br />
Return On Equity 48.9% 37.3% 31.6% NM 9.1%<br />
Management & Consulting Fees / Total Op. Income 0.6% 1.1% 8.6% NM 5.0%<br />
Realized Inv. Income / Total Operating Income 44.6% 27.2% 38.0% NM 91.7%<br />
Investments / Total Assets 94.9% 97.6% 96.4% 97.0% 94.6%<br />
Total Debt / Total Assets 25.1% 16.8% 37.6% 39.0% 51.1%<br />
Historical Share Data* YTD<br />
2004 2005 2006 2007 22-Jun-08<br />
Market Capitalization (KD thousand) 129,806 212,520 101,736 96,381 139,396<br />
Closing Share Price (KD) 0.430 0.640 0.285 0.270 0.355<br />
Highest Price for the Period (KD) 0.480 1.480 0.650 0.400 0.435<br />
Lowest Price for the Period (KD) 0.230 0.410 0.238 0.248 0.216<br />
Volume (Shares thousand) 728,350 1,293,568 576,785 533,740 417,620<br />
Value (KD thousand) 276,283 1,152,350 219,426 177,583 142,798<br />
No. of Trades 22,246 79,432 29,447 23,033 12,863<br />
EPS (KD) 0.087 0.090 (0.021) 0.022 0.022<br />
Book Value Per Share (KD) 0.257 0.306 0.243 0.242 0.242<br />
Dividend Per Share (KD) 0.040 0.025 0.010 0.010 NA<br />
Price to Earnings Multiple (X) #<br />
4.08 3.93 NM 16.12 16.12<br />
Price to Book Value Multiple (X) #<br />
1.38 1.16 1.46 1.47 1.47<br />
Dividend Yield (%) #<br />
11.27 7.04 2.82 2.82 2.82<br />
KD<br />
0.435<br />
0.410<br />
0.385<br />
0.360<br />
0.335<br />
0.310<br />
0.285<br />
0.260<br />
0.235<br />
0.210<br />
52-Week Price Chart Rel. to KAMCO TRW Index<br />
BAYANINV KAMCO TRW Index<br />
24.6.07<br />
8.7.07<br />
22.7.07<br />
5.8.07<br />
19.8.07<br />
2.9.07<br />
16.9.07<br />
30.9.07<br />
14.10.07<br />
28.10.07<br />
11.11.07<br />
25.11.07<br />
9.12.07<br />
23.12.07<br />
6.1.08<br />
20.1.08<br />
3.2.08<br />
17.2.08<br />
2.3.08<br />
16.3.08<br />
30.3.08<br />
13.4.08<br />
27.4.08<br />
11.5.08<br />
25.5.08<br />
8.6.08<br />
22.6.08<br />
Index<br />
4,800<br />
4,700<br />
4,600<br />
4,500<br />
4,400<br />
4,300<br />
4,200<br />
4,100<br />
4,000<br />
NA: Not Applicable, NM: Not Meaningful<br />
N/A: Not Available, YTD: Beginning of year to date<br />
#<br />
:Historical P/E, P/B & Yield are based on<br />
current price & historical earning per share,<br />
book value per share & dividend per share<br />
Investment Research Department<br />
KIPCO Asset Management Co.K.S.C.C<br />
KAMCO<br />
P.O.Box: 28873 Safat 13149 <strong>Kuwait</strong><br />
Email : kamco_research@kamconline.com


