

Kuwait Corporate Fact Sheet
Kuwait Corporate Fact Sheet
Kuwait Corporate Fact Sheet

You also want an ePaper? Increase the reach of your titles
YUMPU automatically turns print PDFs into web optimized ePapers that Google loves.
Global Investment House Co. <strong>Fact</strong> <strong>Sheet</strong><br />
Investment Sector<br />
Reuters Code: GLOB.KW Current Price (KD) : 1.040<br />
Key <strong>Fact</strong>s<br />
KD ' 000 2003 2004 2005 2006 2007<br />
Cash & Cash Equivalent 7,893 7,331 31,740 66,830 68,797<br />
Held For Trading Investments 2,391 3,591 83,865 297,334 374,648<br />
Available For Sale Investments 26,689 62,120 92,258 146,070 188,836<br />
Investments in Unconsolidated Sub. & Associated Co. 0 1,792 16,637 52,062 95,782<br />
Investment in Properties 0 0 5,959 414 41,433<br />
Loans & Advances 8,499 19,242 50,303 41,019 24,615<br />
Other Assets 4,655 5,057 19,933 88,162 118,846<br />
Total Assets 50,127 99,134 300,695 691,891 912,957<br />
Money Market Loans 13,493 4,066 54,796 201,670 244,349<br />
Bonds 0 20,000 20,000 20,000 65,000<br />
Medium Term Borrowings 0 0 0 55,972 84,754<br />
Wakala Payables 0 20,578 87,248 134,286 149,167<br />
Other Liabilities 2,784 5,730 9,547 30,997 40,222<br />
Total Liabilities 16,276 50,374 171,591 442,925 583,492<br />
Minority Interest 0 0 8,608 4,582 6,414<br />
Equity 33,851 48,760 120,496 244,384 323,051<br />
Placement, Advisory, & Management Fees 11,823 16,204 25,641 33,926 36,303<br />
Total Realized Investment Income/(Loss) 3,477 7,180 30,586 46,659 87,198<br />
Total Unrealized Investment Income/(Loss) 2,516 5,828 23,871 29,775 30,873<br />
Total Operating Revenue 17,816 29,213 80,098 110,360 154,374<br />
Total Operating Expenses 4,986 7,104 16,502 34,986 58,890<br />
Operating Profit 12,831 22,109 63,596 75,374 95,484<br />
Other Non-operating Expenses 385 789 2,210 3,964 4,119<br />
Net Profit 12,445 21,320 61,386 71,410 91,365<br />
Key Ratios<br />
KAMCO Research<br />
June 22, 2008<br />
2003 2004 2005 2006 2007<br />
Return On Assets (%) 24.8% 21.5% 20.4% 10.3% 10.0%<br />
Return On Equity (%) 36.8% 43.7% 50.9% 29.2% 28.3%<br />
Total Fees / Total Operating Revenue 66.4% 55.5% 32.0% 30.7% 23.5%<br />
Investments / Total Assets (%) 58.0% 68.1% 66.1% 71.7% 76.8%<br />
Loans & Advances / Total Assets (%) 17.0% 19.4% 16.7% 5.9% 2.7%<br />
Total Liabilities / Total Assets (%) 32.5% 50.8% 57.1% 64.0% 63.9%<br />
Historical Share Data YTD<br />
2004 2005 2006 2007 22-Jun-08<br />
Market Capitalization (KD thousand) 206,010 750,811 775,995 850,964 1,296,212<br />
Closing Share Price (KD) 0.990 2.700 1.100 0.990 1.040<br />
Highest Price for the Period (KD) 1.000 2.860 3.240 1.080 1.240<br />
Lowest Price for the Period (KD) 0.540 0.980 0.930 0.680 0.900<br />
Volume ('000 shares) 191,830 183,231 182,553 451,193 301,368<br />
Value ('000 KD) 132,073 286,302 254,662 386,793 318,091<br />
No. of Trades 8,686 13,197 13,959 15,556 10,900<br />
EPS (KD) 0.094 0.103 0.089 0.109 0.109<br />
Book Value Per Share (KD) 0.239 0.438 0.355 0.377 0.377<br />
Dividend Per Share (KD) 0.070 0.070 0.050 0.050 NA<br />
Price to Earnings Multiple (X) #<br />
11.03 10.11 11.69 9.53 9.53<br />
Price to Book Value Multiple (X) #<br />
4.36 2.37 2.93 2.76 2.76<br />
Dividend Yield (%) #<br />
6.73 6.73 4.81 4.81 4.81<br />
KD<br />
1.250<br />
1.200<br />
1.150<br />
1.100<br />
1.050<br />
1.000<br />
0.950<br />
0.900<br />
0.850<br />
0.800<br />
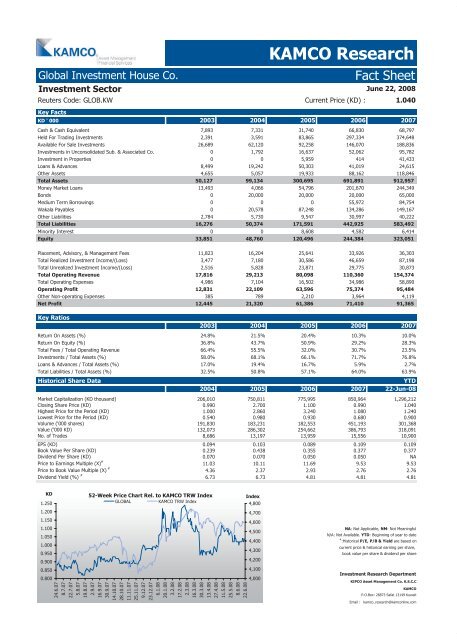
52-Week Price Chart Rel. to KAMCO TRW Index<br />
GLOBAL KAMCO TRW Index<br />
24.6.07<br />
8.7.07<br />
22.7.07<br />
5.8.07<br />
19.8.07<br />
2.9.07<br />
16.9.07<br />
30.9.07<br />
14.10.07<br />
28.10.07<br />
11.11.07<br />
25.11.07<br />
9.12.07<br />
23.12.07<br />
6.1.08<br />
20.1.08<br />
3.2.08<br />
17.2.08<br />
2.3.08<br />
16.3.08<br />
30.3.08<br />
13.4.08<br />
27.4.08<br />
11.5.08<br />
25.5.08<br />
8.6.08<br />
22.6.08<br />
Index<br />
4,800<br />
4,700<br />
4,600<br />
4,500<br />
4,400<br />
4,300<br />
4,200<br />
4,100<br />
4,000<br />
NA: Not Applicable, NM: Not Meaningful<br />
N/A: Not Available. YTD: Beginning of year to date<br />
#<br />
:Historical P/E, P/B & Yield are based on<br />
current price & historical earning per share,<br />
book value per share & dividend per share<br />
Investment Research Department<br />
KIPCO Asset Management Co. K.S.C.C<br />
KAMCO<br />
P.O.Box: 28873 Safat 13149 <strong>Kuwait</strong><br />
Email : kamco_research@kamconline.com


