

Kuwait Corporate Fact Sheet
Kuwait Corporate Fact Sheet
Kuwait Corporate Fact Sheet

You also want an ePaper? Increase the reach of your titles
YUMPU automatically turns print PDFs into web optimized ePapers that Google loves.
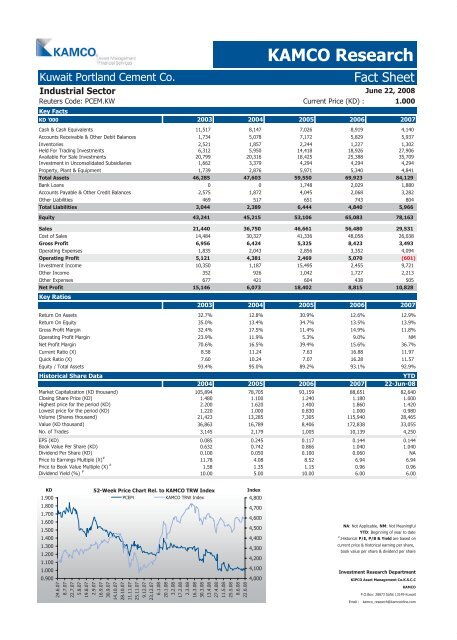
<strong>Kuwait</strong> Portland Cement Co. <strong>Fact</strong> <strong>Sheet</strong><br />
Industrial Sector<br />
Reuters Code: PCEM.KW Current Price (KD) : 1.000<br />
Key <strong>Fact</strong>s<br />
KAMCO Research<br />
June 22, 2008<br />
KD '000 2003 2004 2005 2006 2007<br />
Cash & Cash Equivalents 11,517 8,147 7,026 8,919 4,140<br />
Accounts Receivable & Other Debit Balances 1,734 5,078 7,172 5,829 5,937<br />
Inventories 2,521 1,857 2,244 1,227 1,302<br />
Held For Trading Investments 6,312 5,950 14,418 18,926 27,906<br />
Available For Sale Investments 20,799 20,316 18,425 25,388 35,709<br />
Investment in Unconsolidated Subsidiaries 1,662 3,379 4,294 4,294 4,294<br />
Property, Plant & Equipment 1,739 2,876 5,971 5,340 4,841<br />
Total Assets 46,285 47,603 59,550 69,923 84,129<br />
Bank Loans 0 0 1,748 2,029 1,880<br />
Accounts Payable & Other Credit Balances 2,575 1,872 4,045 2,068 3,282<br />
Other Liabilities 469 517 651 743 804<br />
Total Liabilities 3,044 2,389 6,444 4,840 5,966<br />
Equity 43,241 45,215 53,106 65,083 78,163<br />
Sales 21,440 36,750 46,661 56,480 29,531<br />
Cost of Sales 14,484 30,327 41,336 48,058 26,038<br />
Gross Profit 6,956 6,424 5,325 8,423 3,493<br />
Operating Expenses 1,835 2,043 2,856 3,352 4,094<br />
Operating Profit 5,121 4,381 2,469 5,070 (601)<br />
Investment Income 10,350 1,187 15,495 2,455 9,721<br />
Other Income 352 926 1,042 1,727 2,213<br />
Other Expenses 677 421 604 438 505<br />
Net Profit<br />
Key Ratios<br />
15,146 6,073 18,402 8,815 10,828<br />
2003 2004 2005 2006 2007<br />
Return On Assets 32.7% 12.8% 30.9% 12.6% 12.9%<br />
Return On Equity 35.0% 13.4% 34.7% 13.5% 13.9%<br />
Gross Profit Margin 32.4% 17.5% 11.4% 14.9% 11.8%<br />
Operating Profit Margin 23.9% 11.9% 5.3% 9.0% NM<br />
Net Profit Margin 70.6% 16.5% 39.4% 15.6% 36.7%<br />
Current Ratio (X) 8.58<br />
11.24<br />
7.63<br />
16.88<br />
11.97<br />
Quick Ratio (X) 7.60<br />
10.24<br />
7.07<br />
16.28<br />
11.57<br />
Equity / Total Assets 93.4% 95.0% 89.2% 93.1% 92.9%<br />
Historical Share Data YTD<br />
2004 2005 2006 2007 22-Jun-08<br />
Market Capitalization (KD thousand) 105,894 78,705 93,159 88,651 82,640<br />
Closing Share Price (KD) 1.480 1.100 1.240 1.180 1.000<br />
Highest price for the period (KD) 2.200 1.620 1.400 1.860 1.420<br />
Lowest price for the period (KD) 1.220 1.000 0.830 1.000 0.980<br />
Volume (Shares thousand) 21,423 13,285 7,305 115,940 28,465<br />
Value (KD thousand) 36,863 16,789 8,406 172,838 33,055<br />
No. of Trades 3,145 2,179 1,005 10,139 4,250<br />
EPS (KD) 0.085 0.245 0.117 0.144 0.144<br />
Book Value Per Share (KD) 0.632 0.742 0.866 1.040 1.040<br />
Dividend Per Share (KD) 0.100 0.050 0.100 0.060 NA<br />
Price to Earnings Multiple (X) #<br />
11.78 4.08 8.52 6.94 6.94<br />
Price to Book Value Multiple (X) #<br />
1.58 1.35 1.15 0.96 0.96<br />
Dividend Yield (%) #<br />
10.00 5.00 10.00 6.00 6.00<br />
KD<br />
1.900<br />
1.800<br />
1.700<br />
1.600<br />
1.500<br />
1.400<br />
1.300<br />
1.200<br />
1.100<br />
1.000<br />
0.900<br />
52-Week Price Chart Rel. to KAMCO TRW Index<br />
PCEM KAMCO TRW Index<br />
24.6.07<br />
8.7.07<br />
22.7.07<br />
5.8.07<br />
19.8.07<br />
2.9.07<br />
16.9.07<br />
30.9.07<br />
14.10.07<br />
28.10.07<br />
11.11.07<br />
25.11.07<br />
9.12.07<br />
23.12.07<br />
6.1.08<br />
20.1.08<br />
3.2.08<br />
17.2.08<br />
2.3.08<br />
16.3.08<br />
30.3.08<br />
13.4.08<br />
27.4.08<br />
11.5.08<br />
25.5.08<br />
8.6.08<br />
22.6.08<br />
Index<br />
4,800<br />
4,700<br />
4,600<br />
4,500<br />
4,400<br />
4,300<br />
4,200<br />
4,100<br />
4,000<br />
NA: Not Applicable, NM: Not Meaningful<br />
YTD: Beginning of year to date<br />
#<br />
:Historical P/E, P/B & Yield are based on<br />
current price & historical earning per share,<br />
book value per share & dividend per share<br />
Investment Research Department<br />
KIPCO Asset Management Co.K.S.C.C<br />
KAMCO<br />
P.O.Box: 28873 Safat 13149 <strong>Kuwait</strong><br />
Email : kamco_research@kamconline.com


