

Kuwait Corporate Fact Sheet
Kuwait Corporate Fact Sheet
Kuwait Corporate Fact Sheet

Create successful ePaper yourself
Turn your PDF publications into a flip-book with our unique Google optimized e-Paper software.
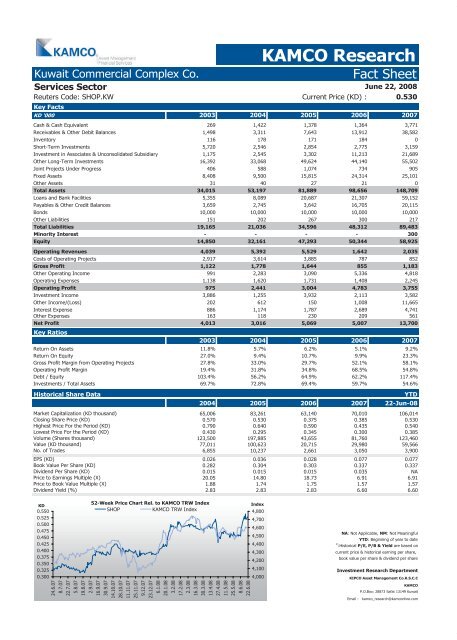
<strong>Kuwait</strong> Commercial Complex Co. <strong>Fact</strong> <strong>Sheet</strong><br />
Services Sector<br />
Reuters Code: SHOP.KW Current Price (KD) : 0.530<br />
Key <strong>Fact</strong>s<br />
KAMCO Research<br />
June 22, 2008<br />
KD '000 2003 2004 2005 2006 2007<br />
Cash & Cash Equivalent 269 1,422 1,378 1,364 3,771<br />
Receivables & Other Debit Balances 1,498 3,311 7,643 13,912 38,582<br />
Inventory 116 178 171 184 0<br />
Short-Term Investments 5,720 2,546 2,854 2,775 3,159<br />
Investment in Associates & Unconsolidated Subsidiary 1,175 2,545 3,302 11,213 21,689<br />
Other Long-Term Investments 16,392 33,068 49,624 44,140 55,502<br />
Joint Projects Under Progress 406 588 1,074 734 905<br />
Fixed Assets 8,408 9,500 15,815 24,314 25,101<br />
Other Assets 31 40 27 21 0<br />
Total Assets 34,015 53,197 81,889 98,656 148,709<br />
Loans and Bank Facilities 5,355 8,089 20,687 21,307 59,152<br />
Payables & Other Credit Balances 3,659 2,745 3,642 16,705 20,115<br />
Bonds 10,000 10,000 10,000 10,000 10,000<br />
Other Liabilities 151 202 267 300 217<br />
Total Liabilities 19,165 21,036 34,596 48,312 89,483<br />
Minority Interest -<br />
-<br />
-<br />
-<br />
300<br />
Equity 14,850 32,161 47,293 50,344 58,925<br />
Operating Revenues 4,039 5,392 5,529 1,642 2,035<br />
Costs of Operating Projects 2,917 3,614 3,885 787 852<br />
Gross Profit 1,122 1,778 1,644 855 1,183<br />
Other Operating Income 991 2,283 3,090 5,336 4,818<br />
Operating Expenses 1,138 1,620 1,731 1,408 2,245<br />
Operating Profit 975 2,441 3,004 4,783 3,755<br />
Investment Income 3,886 1,255 3,932 2,113 3,582<br />
Other Income/(Loss) 202 612 150 1,008 11,665<br />
Interest Expense 886 1,174 1,787 2,689 4,741<br />
Other Expenses 163 118 230 209 561<br />
Net Profit<br />
Key Ratios<br />
4,013 3,016 5,069 5,007 13,700<br />
2003 2004 2005 2006 2007<br />
Return On Assets 11.8% 5.7% 6.2% 5.1% 9.2%<br />
Return On Equity 27.0% 9.4% 10.7% 9.9% 23.3%<br />
Gross Profit Margin from Operating Projects 27.8% 33.0% 29.7% 52.1% 58.1%<br />
Operating Profit Margin 19.4% 31.8% 34.8% 68.5% 54.8%<br />
Debt / Equity 103.4% 56.2% 64.9% 62.2% 117.4%<br />
Investments / Total Assets 69.7% 72.8% 69.4% 59.7% 54.6%<br />
Historical Share Data YTD<br />
2004 2005 2006 2007 22-Jun-08<br />
Market Capitalization (KD thousand) 65,006 83,261 63,140 70,010 106,014<br />
Closing Share Price (KD) 0.570 0.530 0.375 0.385 0.530<br />
Highest Price For the Period (KD) 0.790 0.640 0.590 0.435 0.540<br />
Lowest Price For the Period (KD) 0.430 0.295 0.345 0.300 0.385<br />
Volume (Shares thousand) 123,500 197,885 43,655 81,760 123,460<br />
Value (KD thousand) 77,011 100,623 20,715 29,980 59,566<br />
No. of Trades 6,855 10,237 2,661 3,050 3,900<br />
EPS (KD) 0.026 0.036 0.028 0.077 0.077<br />
Book Value Per Share (KD) 0.282 0.304 0.303 0.337 0.337<br />
Dividend Per Share (KD) 0.015 0.015 0.015 0.035 NA<br />
Price to Earnings Multiple (X) 20.05 14.80 18.73 6.91 6.91<br />
Price to Book Value Multiple (X) 1.88 1.74 1.75 1.57 1.57<br />
Dividend Yield (%) 2.83 2.83 2.83 6.60 6.60<br />
KD<br />
0.550<br />
0.525<br />
0.500<br />
0.475<br />
0.450<br />
0.425<br />
0.400<br />
0.375<br />
0.350<br />
0.325<br />
0.300<br />
52-Week Price Chart Rel. to KAMCO TRW Index<br />
SHOP KAMCO TRW Index<br />
24.6.07<br />
8.7.07<br />
22.7.07<br />
5.8.07<br />
19.8.07<br />
2.9.07<br />
16.9.07<br />
30.9.07<br />
14.10.07<br />
28.10.07<br />
11.11.07<br />
25.11.07<br />
9.12.07<br />
23.12.07<br />
6.1.08<br />
20.1.08<br />
3.2.08<br />
17.2.08<br />
2.3.08<br />
16.3.08<br />
30.3.08<br />
13.4.08<br />
27.4.08<br />
11.5.08<br />
25.5.08<br />
8.6.08<br />
22.6.08<br />
Index<br />
4,800<br />
4,700<br />
4,600<br />
4,500<br />
4,400<br />
4,300<br />
4,200<br />
4,100<br />
4,000<br />
NA: Not Applicable, NM: Not Meaningful<br />
YTD: Beginning of year to date<br />
#<br />
:Historical P/E, P/B & Yield are based on<br />
current price & historical earning per share,<br />
book value per share & dividend per share<br />
Investment Research Department<br />
KIPCO Asset Management Co.K.S.C.C<br />
KAMCO<br />
P.O.Box: 28873 Safat 13149 <strong>Kuwait</strong><br />
Email : kamco_research@kamconline.com


