

Kuwait Corporate Fact Sheet
Kuwait Corporate Fact Sheet
Kuwait Corporate Fact Sheet

You also want an ePaper? Increase the reach of your titles
YUMPU automatically turns print PDFs into web optimized ePapers that Google loves.
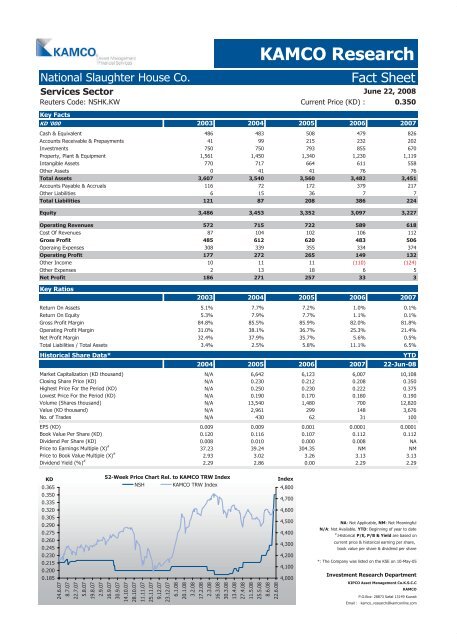
National Slaughter House Co. <strong>Fact</strong> <strong>Sheet</strong><br />
Services Sector<br />
Reuters Code: NSHK.KW Current Price (KD) : 0.350<br />
Key <strong>Fact</strong>s<br />
KD '000 2003 2004 2005 2006 2007<br />
Cash & Equivalent 486 483 508 479 826<br />
Accounts Receivable & Prepayments 41 99 215 232 202<br />
Investments 750 750 793 855 670<br />
Property, Plant & Equipment 1,561 1,450 1,340 1,230 1,119<br />
Intangible Assets 770 717 664 611 558<br />
Other Assets 0 41 41 76 76<br />
Total Assets 3,607 3,540 3,560 3,482 3,451<br />
Accounts Payable & Accruals 116 72 172 379 217<br />
Other Liabilities 6 15 36 7 7<br />
Total Liabilities 121 87 208 386 224<br />
Equity 3,486 3,453 3,352 3,097 3,227<br />
Operating Revenues 572 715 722 589 618<br />
Cost Of Revenues 87 104 102 106 112<br />
Gross Profit 485 612 620 483 506<br />
Operaing Expenses 308 339 355 334 374<br />
Operating Profit 177 272 265 149 132<br />
Other Income 10 11 11 (110) (124)<br />
Other Expenses 2 13 18 6 5<br />
Net Profit 186 271 257 33 3<br />
Key Ratios<br />
KAMCO Research<br />
June 22, 2008<br />
2003 2004 2005 2006 2007<br />
Return On Assets 5.1% 7.7% 7.2% 1.0% 0.1%<br />
Return On Equity 5.3% 7.9% 7.7% 1.1% 0.1%<br />
Gross Profit Margin 84.8% 85.5% 85.9% 82.0% 81.8%<br />
Operating Profit Margin 31.0% 38.1% 36.7% 25.3% 21.4%<br />
Net Profit Margin 32.4% 37.9% 35.7% 5.6% 0.5%<br />
Total Liabilities / Total Assets 3.4% 2.5% 5.8% 11.1% 6.5%<br />
Historical Share Data* YTD<br />
2004 2005 2006 2007 22-Jun-08<br />
Market Capitalization (KD thousand) N/A 6,642 6,123 6,007 10,108<br />
Closing Share Price (KD) N/A 0.230 0.212 0.208 0.350<br />
Highest Price For the Period (KD) N/A 0.250 0.230 0.222 0.375<br />
Lowest Price For the Period (KD) N/A 0.190 0.170 0.180 0.190<br />
Volume (Shares thousand) N/A 13,540 1,480 700 12,820<br />
Value (KD thousand) N/A 2,961 299 148 3,676<br />
No. of Trades N/A 430 62 31 100<br />
EPS (KD) 0.009 0.009 0.001 0.0001 0.0001<br />
Book Value Per Share (KD) 0.120 0.116 0.107 0.112 0.112<br />
Dividend Per Share (KD) 0.008 0.010 0.000 0.008 NA<br />
Price to Earnings Multiple (X) #<br />
37.23 39.24 304.35 NM NM<br />
Price to Book Value Multiple (X) #<br />
2.93 3.02 3.26 3.13 3.13<br />
Dividend Yield (%) #<br />
2.29 2.86 0.00 2.29 2.29<br />
KD<br />
0.365<br />
0.350<br />
0.335<br />
0.320<br />
0.305<br />
0.290<br />
0.275<br />
0.260<br />
0.245<br />
0.230<br />
0.215<br />
0.200<br />
0.185<br />
52-Week Price Chart Rel. to KAMCO TRW Index<br />
NSH KAMCO TRW Index<br />
24.6.07<br />
8.7.07<br />
22.7.07<br />
5.8.07<br />
19.8.07<br />
2.9.07<br />
16.9.07<br />
30.9.07<br />
14.10.07<br />
28.10.07<br />
11.11.07<br />
25.11.07<br />
9.12.07<br />
23.12.07<br />
6.1.08<br />
20.1.08<br />
3.2.08<br />
17.2.08<br />
2.3.08<br />
16.3.08<br />
30.3.08<br />
13.4.08<br />
27.4.08<br />
11.5.08<br />
25.5.08<br />
8.6.08<br />
22.6.08<br />
Index<br />
4,800<br />
4,700<br />
4,600<br />
4,500<br />
4,400<br />
4,300<br />
4,200<br />
4,100<br />
4,000<br />
NA: Not Applicable, NM: Not Meaningful<br />
N/A: Not Available. YTD: Beginning of year to date<br />
#<br />
:Historical P/E, P/B & Yield are based on<br />
current price & historical earning per share,<br />
book value per share & dividend per share<br />
*: The Company was listed on the KSE on 10-May-05<br />
Investment Research Department<br />
KIPCO Asset Management Co.K.S.C.C<br />
KAMCO<br />
P.O.Box: 28873 Safat 13149 <strong>Kuwait</strong><br />
Email : kamco_research@kamconline.com


