

Kuwait Corporate Fact Sheet
Kuwait Corporate Fact Sheet
Kuwait Corporate Fact Sheet

Create successful ePaper yourself
Turn your PDF publications into a flip-book with our unique Google optimized e-Paper software.
Zain <strong>Fact</strong> <strong>Sheet</strong><br />
Services Sector<br />
KAMCO Research<br />
Reuters Code: Zain.KW Current Price (KD) :<br />
June 22, 2008<br />
1.640<br />
Key <strong>Fact</strong>s<br />
KD '000 2003 2004 2005 2006 2007<br />
Cash & Cash Equivalent 98,287 151,472 292,879 474,322 261,263<br />
Trade & Other Receivables 40,076 48,855 80,021 184,485 246,276<br />
Inventories 3,153 1,568 7,025 14,791 22,047<br />
Short-Term Investments 31,677 11,818 14,566 18,455 23,002<br />
Investment in Associates 0 5,362 236,383 8,026 430,515<br />
Long-Term Investments 109,857 130,292 147,111 134,842 179,468<br />
Property & Equipment 216,935 219,580 499,853 1,131,189 1,495,602<br />
Intangible Assets 87,187 80,734 756,838 1,477,557 1,637,255<br />
Other Assets 0 0 21,631 47,266 71,574<br />
Total Assets 587,172 649,681 2,056,307 3,490,933 4,367,002<br />
Trade & Other Payables 114,681 132,028 240,915 427,396 554,754<br />
Short-Term Loans 28,052 26,525 248,417 460,721 453,747<br />
Long-Term Loans 96,553 85,804 190,342 921,117 1,531,512<br />
Due to Minority Interest Holders 0 0 131,154 155,262 18,509<br />
Other Liabilities 8,668 13,952 26,895 26,003 60,174<br />
Total Liabilities 247,954 258,309 837,723 1,990,499 2,618,696<br />
Minority Interest 2,927 2,006 32,844 146,002 166,379<br />
Equity 336,291 389,366 1,185,740 1,354,432 1,581,927<br />
Operating Revenues 262,606 322,327 579,496 1,297,415 1,677,270<br />
Cost of Revenues 42,561 47,521 90,741 274,729 361,751<br />
Gross Profit 220,045 274,806 488,755 1,022,686 1,315,519<br />
Operating Expenses 117,744 151,349 289,539 623,300 863,877<br />
Operating Profit 102,301 123,457 199,216 399,386 451,642<br />
Investment Income 12,288 9,959 46,230 13,635 18,402<br />
Other Income 4,346 6,548 20,318 12,307 23,319<br />
Interest Expense 5,642 5,309 50,224 88,084 123,586<br />
Other Expenses 11,081 14,414 33,628 42,263 49,322<br />
Net Profit<br />
Key Ratios<br />
102,212 120,241 181,912 294,981 320,455<br />
2003 2004 2005 2006 2007<br />
Return On Assets 17.4% 18.5% 8.8% 8.4% 7.3%<br />
Return On Equity 30.4% 30.9% 15.3% 21.8% 20.3%<br />
Gross Profit Margin 83.8% 85.3% 84.3% 78.8% 78.4%<br />
Operating Profit Margin 39.0% 38.3% 34.4% 30.8% 26.9%<br />
Net Profit Margin 38.9% 37.3% 31.4% 22.7% 19.1%<br />
Debt / Equity 37.1% 28.8% 37.0% 102.0% 125.5%<br />
Historical Share Data YTD<br />
2004 2005 2006 2007 22-Jun-08<br />
Market Capitalization (KD thousand) 1,761,078 3,862,264 4,189,241 7,235,004 6,989,519<br />
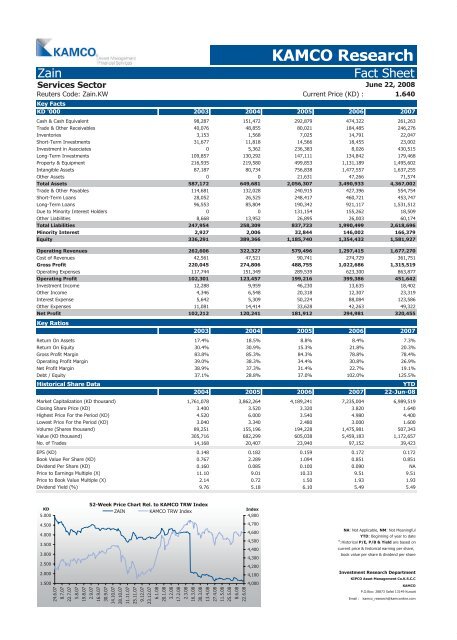
Closing Share Price (KD) 3.400 3.520 3.320 3.820 1.640<br />
Highest Price For the Period (KD) 4.520 6.000 3.540 4.980 4.400<br />
Lowest Price For the Period (KD) 3.040 3.340 2.480 3.000 1.600<br />
Volume (Shares thousand) 89,251 155,196 194,228 1,475,981 507,343<br />
Value (KD thousand) 305,716 682,299 605,038 5,459,183 1,172,657<br />
No. of Trades 14,168 20,407 23,940 97,152 39,423<br />
EPS (KD) 0.148 0.182 0.159 0.172 0.172<br />
Book Value Per Share (KD) 0.767 2.289 1.094 0.851 0.851<br />
Dividend Per Share (KD) 0.160 0.085 0.100 0.090 NA<br />
Price to Earnings Multiple (X) 11.10 9.01 10.33 9.51 9.51<br />
Price to Book Value Multiple (X) 2.14 0.72 1.50 1.93 1.93<br />
Dividend Yield (%) 9.76 5.18 6.10 5.49 5.49<br />
KD<br />
5.000<br />
4.500<br />
4.000<br />
3.500<br />
3.000<br />
2.500<br />
2.000<br />
1.500<br />
52-Week Price Chart Rel. to KAMCO TRW Index<br />
ZAIN KAMCO TRW Index<br />
24.6.07<br />
8.7.07<br />
22.7.07<br />
5.8.07<br />
19.8.07<br />
2.9.07<br />
16.9.07<br />
30.9.07<br />
14.10.07<br />
28.10.07<br />
11.11.07<br />
25.11.07<br />
9.12.07<br />
23.12.07<br />
6.1.08<br />
20.1.08<br />
3.2.08<br />
17.2.08<br />
2.3.08<br />
16.3.08<br />
30.3.08<br />
13.4.08<br />
27.4.08<br />
11.5.08<br />
25.5.08<br />
8.6.08<br />
22.6.08<br />
Index<br />
4,800<br />
4,700<br />
4,600<br />
4,500<br />
4,400<br />
4,300<br />
4,200<br />
4,100<br />
4,000<br />
NA: Not Applicable, NM: Not Meaningful<br />
YTD: Beginning of year to date<br />
#<br />
:Historical P/E, P/B & Yield are based on<br />
current price & historical earning per share,<br />
book value per share & dividend per share<br />
Investment Research Department<br />
KIPCO Asset Management Co.K.S.C.C<br />
KAMCO<br />
P.O.Box: 28873 Safat 13149 <strong>Kuwait</strong><br />
Email : kamco_research@kamconline.com


