

Kuwait Corporate Fact Sheet
Kuwait Corporate Fact Sheet
Kuwait Corporate Fact Sheet

Create successful ePaper yourself
Turn your PDF publications into a flip-book with our unique Google optimized e-Paper software.
<strong>Kuwait</strong> Financial Centre <strong>Fact</strong> <strong>Sheet</strong><br />
Investment Sector<br />
Reuters Code: MARKZ.KW Current Price (KD) : 0.280<br />
Key <strong>Fact</strong>s<br />
KAMCO Research<br />
June 22, 2008<br />
KD ' 000 2003 2004 2005 2006 2007<br />
Cash & Cash Equivalent 1,292 1,443 3,584 3,006 2,430<br />
Short-Term Investments 13,618 42,400 59,795 51,842 72,185<br />
Long-Term Investments 48,840 44,387 60,347 66,827 76,829<br />
Loans to Customers 8,376 10,727 21,779 16,439 20,388<br />
Investment in Property 1,109 36 36 36 3,101<br />
Other Assets 5,006 3,044 5,963 4,333 12,785<br />
Total Assets 78,241 102,037 151,504 142,483 187,718<br />
Short-Term Loans 3,062 17,651 17,639 32,906 23,422<br />
Other Liabilities 4,153 2,968 5,111 3,907 5,760<br />
Bonds 27,300<br />
Total Liabilities 7,215 20,619 22,750 36,813 56,482<br />
Minority 54 66<br />
Equity 71,026 81,418 128,754 105,616 131,170<br />
Management Fees & Commissions 5,578 7,201 14,099 11,412 15,700<br />
Realized Investment Income 5,388 8,195 14,559 8,656 17,683<br />
Unrealized Investment Income 4,725 4,716 18,514 (7,640) 4,561<br />
Other Operating Income/(Loss) 323 107 (154) 313 (588)<br />
Total Operating Income 16,014 20,219 47,018 12,741 37,356<br />
General & Administrative Expenses 2,010 3,701 5,369 5,233 6,567<br />
Operating Profit Before Interest Expense 14,004 16,518 41,649 7,508 30,789<br />
Interest Expense 203 388 535 1,867 2,310<br />
Other Income/(Loss) (3,724) (1,173) (1,036) 4 (340)<br />
Other Expenses 452 601 1,409 299 1,122<br />
Net Profit<br />
Key Ratios<br />
9,625 14,356 38,669 5,346 27,017<br />
2003 2004 2005 2006 2007<br />
Return On Assets 12.3% 14.1% 25.5% 3.8% 14.4%<br />
Return On Equity 13.6% 17.6% 30.0% 5.1% 20.6%<br />
Mgmt Fees & Commissions / Total Operating Income 34.8% 35.6% 30.0% 89.6% 42.0%<br />
Realized Inv. Income / Total Operating Income 33.6% 40.5% 31.0% 67.9% 47.3%<br />
Investments / Total Assets 81.2% 85.1% 79.3% 83.3% 81.0%<br />
Total Liabilities/ Total Assets 9.2% 20.2% 15.0% 25.8% 30.1%<br />
Historical Share Data YTD<br />
2004 2005 2006 2007 22-Jun-08<br />
Market Capitalization (KD thousand) 97,600 280,000 114,400 158,400 141,680<br />
Closing Share Price (KD) 0.244 0.700 0.260 0.360 0.280<br />
Highest Price for the Period (KD) 0.255 0.810 0.750 0.450 0.420<br />
Lowest Price for the Period (KD) 0.156 0.240 0.232 0.238 0.265<br />
Volume (Shares thousand) 808,360 1,322,550 668,070 652,910 129,620<br />
Value (KD thousand) 172,585 688,582 264,744 234,418 46,107<br />
No. of Trades 13,440 35,158 23,827 17,807 3,802<br />
EPS (KD) 0.038 0.097 0.013 0.065 0.065<br />
Book Value Per Share (KD) 0.209 0.322 0.253 0.319 0.319<br />
Dividend Per Share (KD) 0.020 0.050 0.010 0.025 NA<br />
Price to Earnings Multiple (X) #<br />
7.39 2.90 22.33 4.32 4.32<br />
Price to Book Value Multiple (X) #<br />
1.34 0.87 1.11 0.88 0.88<br />
Dividend Yield (%) #<br />
7.14 17.86 3.57 8.93 8.93<br />
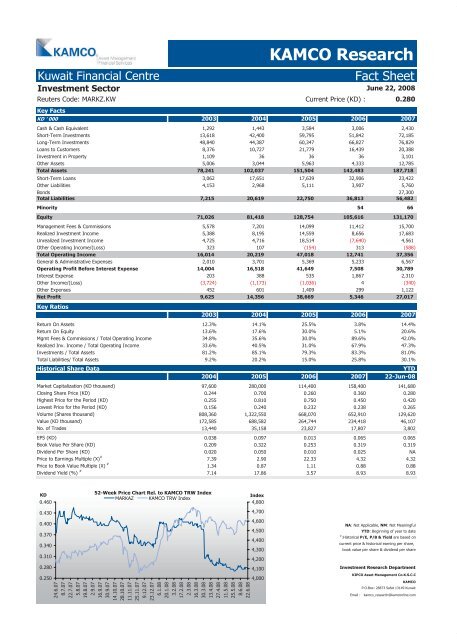
KD<br />
0.460<br />
0.430<br />
0.400<br />
0.370<br />
0.340<br />
0.310<br />
0.280<br />
0.250<br />
52-Week Price Chart Rel. to KAMCO TRW Index<br />
MARKAZ KAMCO TRW Index<br />
24.6.07<br />
8.7.07<br />
22.7.07<br />
5.8.07<br />
19.8.07<br />
2.9.07<br />
16.9.07<br />
30.9.07<br />
14.10.07<br />
28.10.07<br />
11.11.07<br />
25.11.07<br />
9.12.07<br />
23.12.07<br />
6.1.08<br />
20.1.08<br />
3.2.08<br />
17.2.08<br />
2.3.08<br />
16.3.08<br />
30.3.08<br />
13.4.08<br />
27.4.08<br />
11.5.08<br />
25.5.08<br />
8.6.08<br />
22.6.08<br />
Index<br />
4,800<br />
4,700<br />
4,600<br />
4,500<br />
4,400<br />
4,300<br />
4,200<br />
4,100<br />
4,000<br />
NA: Not Applicable, NM: Not Meaningful<br />
YTD: Beginning of year to date<br />
#<br />
:Historical P/E, P/B & Yield are based on<br />
current price & historical earning per share,<br />
book value per share & dividend per share<br />
Investment Research Department<br />
KIPCO Asset Management Co.K.S.C.C<br />
KAMCO<br />
P.O.Box: 28873 Safat 13149 <strong>Kuwait</strong><br />
Email : kamco_research@kamconline.com


