

Kuwait Corporate Fact Sheet
Kuwait Corporate Fact Sheet
Kuwait Corporate Fact Sheet

Create successful ePaper yourself
Turn your PDF publications into a flip-book with our unique Google optimized e-Paper software.
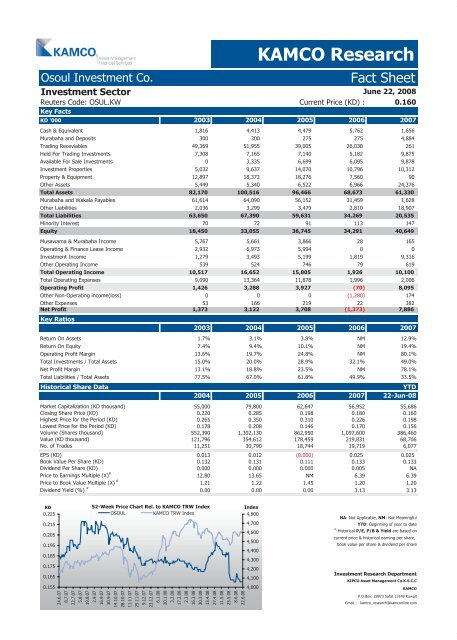
Osoul Investment Co. <strong>Fact</strong> <strong>Sheet</strong><br />
Investment Sector<br />
KAMCO Research<br />
June 22, 2008<br />
Reuters Code: OSUL.KW Current Price (KD) : 0.160<br />
Key <strong>Fact</strong>s<br />
KD '000 2003 2004 2005 2006 2007<br />
Cash & Equivalent 1,816 4,413 4,479 5,762 1,656<br />
Murabaha and Deposits 300 300 275 275 4,884<br />
Trading Receviables 49,369 51,955 39,005 26,038 261<br />
Held For Trading Investments 7,308 7,165 7,140 5,182 9,875<br />
Available For Sale Investments 0 3,335 6,699 6,095 9,878<br />
Investment Properties 5,032 9,637 14,070 10,796 10,312<br />
Property & Equipment 12,897 18,372 18,276 7,560 90<br />
Other Assets 5,449 5,340 6,522 6,966 24,376<br />
Total Assets 82,170 100,516 96,466 68,673 61,330<br />
Murabaha and Wakala Payables 61,614 64,090 56,152 31,459 1,628<br />
Other Liabilities 2,036 3,299 3,479 2,810 18,907<br />
Total Liabilities 63,650 67,390 59,631 34,269 20,535<br />
Minority Interest 70 72 91 113 147<br />
Equity 18,450 33,055 36,745 34,291 40,649<br />
Musawama & Murabaha Income 5,767 5,661 3,866 28 165<br />
Operating & Finance Lease Income 2,932 6,973 5,994 0 0<br />
Investment Income 1,279 3,493 5,199 1,819 9,316<br />
Other Operating Income 539 524 746 79 619<br />
Total Operating Income 10,517 16,652 15,805 1,926 10,100<br />
Total Operating Expenses 9,090 13,364 11,878 1,996 2,006<br />
Operating Profit 1,426 3,288 3,927 (70) 8,095<br />
Other Non-Operating income(loss) 0 0 0 (1,280) 174<br />
Other Expenses 53 166 219 22 382<br />
Net Profit<br />
Key Ratios<br />
1,373 3,122 3,708 (1,373) 7,886<br />
2003 2004 2005 2006 2007<br />
Return On Assets 1.7% 3.1% 3.8% NM 12.9%<br />
Return On Equity 7.4% 9.4% 10.1% NM 19.4%<br />
Operating Profit Margin 13.6% 19.7% 24.8% NM 80.1%<br />
Total Investments / Total Assets 15.0% 20.0% 28.9% 32.1% 49.0%<br />
Net Profit Margin 13.1% 18.8% 23.5% NM 78.1%<br />
Total Liabilities / Total Assets 77.5% 67.0% 61.8% 49.9% 33.5%<br />
Historical Share Data YTD<br />
2004 2005 2006 2007 22-Jun-08<br />
Market Capitalization (KD thousand) 55,000 79,800 62,647 56,952 55,686<br />
Closing Share Price (KD) 0.220 0.285 0.198 0.180 0.160<br />
Highest Price for the Period (KD) 0.265 0.350 0.310 0.226 0.198<br />
Lowest Price for the Period (KD) 0.178 0.208 0.146 0.170 0.156<br />
Volume (Shares thousand) 552,390 1,302,130 862,950 1,097,600 386,460<br />
Value (KD thousand) 121,796 354,612 178,459 219,831 68,706<br />
No. of Trades 11,251 30,790 18,744 19,719 6,077<br />
EPS (KD) 0.013 0.012 (0.000) 0.025 0.025<br />
Book Value Per Share (KD) 0.132 0.131 0.111 0.133 0.133<br />
Dividend Per Share (KD) 0.000 0.000 0.000 0.005 NA<br />
Price to Earnings Multiple (X) #<br />
12.80 13.65 NM 6.39 6.39<br />
Price to Book Value Multiple (X) #<br />
1.21 1.22 1.45 1.20 1.20<br />
Dividend Yield (%) #<br />
0.00 0.00 0.00 3.13 3.13<br />
KD<br />
0.225<br />
0.215<br />
0.205<br />
0.195<br />
0.185<br />
0.175<br />
0.165<br />
0.155<br />
52-Week Price Chart Rel. to KAMCO TRW Index<br />
OSOUL KAMCO TRW Index<br />
24.6.07<br />
8.7.07<br />
22.7.07<br />
5.8.07<br />
19.8.07<br />
2.9.07<br />
16.9.07<br />
30.9.07<br />
14.10.07<br />
28.10.07<br />
11.11.07<br />
25.11.07<br />
9.12.07<br />
23.12.07<br />
6.1.08<br />
20.1.08<br />
3.2.08<br />
17.2.08<br />
2.3.08<br />
16.3.08<br />
30.3.08<br />
13.4.08<br />
27.4.08<br />
11.5.08<br />
25.5.08<br />
8.6.08<br />
22.6.08<br />
Index<br />
4,800<br />
4,700<br />
4,600<br />
4,500<br />
4,400<br />
4,300<br />
4,200<br />
4,100<br />
4,000<br />
NA: Not Applicable, NM: Not Meaningful<br />
YTD: Beginning of year to date<br />
#<br />
:Historical P/E, P/B & Yield are based on<br />
current price & historical earning per share,<br />
book value per share & dividend per share<br />
Investment Research Department<br />
KIPCO Asset Management Co.K.S.C.C<br />
KAMCO<br />
P.O.Box: 28873 Safat 13149 <strong>Kuwait</strong><br />
Email : kamco_research@kamconline.com


