

Kuwait Corporate Fact Sheet
Kuwait Corporate Fact Sheet
Kuwait Corporate Fact Sheet

You also want an ePaper? Increase the reach of your titles
YUMPU automatically turns print PDFs into web optimized ePapers that Google loves.
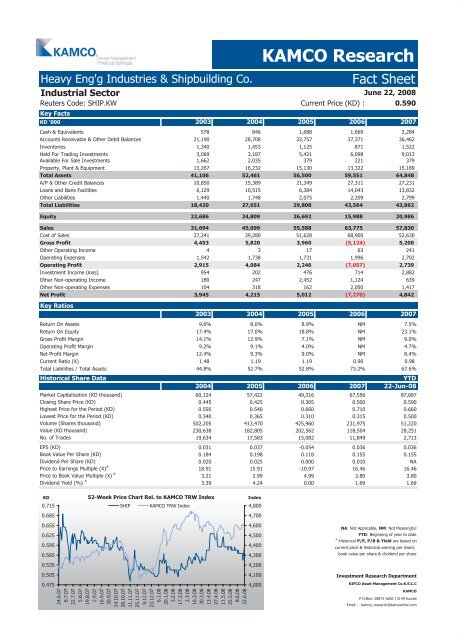
Heavy Eng'g Industries & Shipbuilding Co. <strong>Fact</strong> <strong>Sheet</strong><br />
Industrial Sector<br />
Reuters Code: SHIP.KW Current Price (KD) : 0.590<br />
Key <strong>Fact</strong>s<br />
KD '000 2003 2004 2005 2006 2007<br />
Cash & Equivalents 578 846 1,688 1,669 2,284<br />
Accounts Receivable & Other Debit Balances 21,190 28,708 32,757 37,371 36,462<br />
Inventories 1,340 1,453 1,125 871 1,522<br />
Held For Trading Investments 3,069 3,187 5,421 6,098 9,013<br />
Available For Sale Investments 1,662 2,035 379 221 379<br />
Property, Plant & Equipment 13,267 16,232 15,130 13,322 15,189<br />
Total Assets 41,106 52,461 56,500 59,551 64,848<br />
A/P & Other Credit Balances 10,850 15,389 21,349 27,311 27,231<br />
Loans and Bans Facilities 6,129 10,515 6,384 14,043 13,832<br />
Other Liabilities 1,440 1,748 2,075 2,209 2,799<br />
Total Liabilities 18,420 27,651 29,808 43,564 43,862<br />
Equity 22,686 24,809 26,692 15,988 20,986<br />
Sales 31,694 45,099 55,588 63,775 57,830<br />
Cost of Sales 27,241 39,280 51,628 68,900 52,630<br />
Gross Profit 4,453 5,820 3,960 (5,124) 5,200<br />
Other Operating Income 4 3 17 63 241<br />
Operating Expenses 1,542 1,738 1,731 1,996 2,702<br />
Operating Profit 2,915 4,084 2,246 (7,057) 2,739<br />
Investment Income (loss) 954 202 476 714 2,882<br />
Other Non-operating Income 180 247 2,452 1,124 639<br />
Other Non-operating Expenses 104 318 162 2,050 1,417<br />
Net Profit 3,945 4,215 5,012 (7,270) 4,842<br />
Key Ratios<br />
KAMCO Research<br />
June 22, 2008<br />
2003 2004 2005 2006 2007<br />
Return On Assets 9.6% 8.0% 8.9% NM 7.5%<br />
Return On Equity 17.4% 17.0% 18.8% NM 23.1%<br />
Gross Profit Margin 14.1% 12.9% 7.1% NM 9.0%<br />
Operating Profit Margin 9.2% 9.1% 4.0% NM 4.7%<br />
Net Profit Margin 12.4% 9.3% 9.0% NM 8.4%<br />
Current Ratio (X) 1.48<br />
1.19<br />
1.19<br />
0.90<br />
0.98<br />
Total Liabilities / Total Assets 44.8% 52.7% 52.8% 73.2% 67.6%<br />
Historical Share Data YTD<br />
2004 2005 2006 2007 22-Jun-08<br />
Market Capitalization (KD thousand) 60,124 57,422 49,316 67,556 87,687<br />
Closing Share Price (KD) 0.445 0.425 0.365 0.500 0.590<br />
Highest Price for the Period (KD) 0.550 0.540 0.660 0.710 0.660<br />
Lowest Price for the Period (KD) 0.340 0.365 0.310 0.315 0.500<br />
Volume (Shares thousand) 502,205 413,470 425,960 231,975 51,220<br />
Value (KD thousand) 230,638 182,805 202,562 118,504 28,251<br />
No. of Trades 19,634 17,583 15,082 11,849 2,713<br />
EPS (KD) 0.031 0.037 -0.054 0.036 0.036<br />
Book Value Per Share (KD) 0.184 0.198 0.118 0.155 0.155<br />
Dividend Per Share (KD) 0.020 0.025 0.000 0.010 NA<br />
Price to Earnings Multiple (X) #<br />
18.91 15.91 -10.97 16.46 16.46<br />
Price to Book Value Multiple (X) #<br />
3.21 2.99 4.99 3.80 3.80<br />
Dividend Yield (%) #<br />
3.39 4.24 0.00 1.69 1.69<br />
KD<br />
0.715<br />
0.685<br />
0.655<br />
0.625<br />
0.595<br />
0.565<br />
0.535<br />
0.505<br />
0.475<br />
52-Week Price Chart Rel. to KAMCO TRW Index<br />
SHIP KAMCO TRW Index<br />
24.6.07<br />
8.7.07<br />
22.7.07<br />
5.8.07<br />
19.8.07<br />
2.9.07<br />
16.9.07<br />
30.9.07<br />
14.10.07<br />
28.10.07<br />
11.11.07<br />
25.11.07<br />
9.12.07<br />
23.12.07<br />
6.1.08<br />
20.1.08<br />
3.2.08<br />
17.2.08<br />
2.3.08<br />
16.3.08<br />
30.3.08<br />
13.4.08<br />
27.4.08<br />
11.5.08<br />
25.5.08<br />
8.6.08<br />
22.6.08<br />
Index<br />
4,800<br />
4,700<br />
4,600<br />
4,500<br />
4,400<br />
4,300<br />
4,200<br />
4,100<br />
4,000<br />
NA: Not Applicable, NM: Not Meaningful<br />
YTD: Beginning of year to date<br />
#<br />
:Historical P/E, P/B & Yield are based on<br />
current price & historical earning per share,<br />
book value per share & dividend per share<br />
Investment Research Department<br />
KIPCO Asset Management Co.K.S.C.C<br />
KAMCO<br />
P.O.Box: 28873 Safat 13149 <strong>Kuwait</strong><br />
Email : kamco_research@kamconline.com


