

Kuwait Corporate Fact Sheet
Kuwait Corporate Fact Sheet
Kuwait Corporate Fact Sheet

Create successful ePaper yourself
Turn your PDF publications into a flip-book with our unique Google optimized e-Paper software.
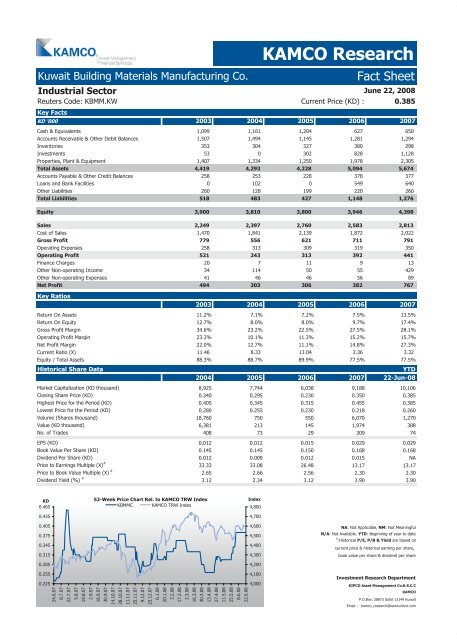
<strong>Kuwait</strong> Building Materials Manufacturing Co. <strong>Fact</strong> <strong>Sheet</strong><br />
Industrial Sector<br />
Reuters Code: KBMM.KW Current Price (KD) : 0.385<br />
Key <strong>Fact</strong>s<br />
KD '000 2003 2004 2005 2006 2007<br />
Cash & Equivalents 1,099 1,161 1,204 627 650<br />
Accounts Receivable & Other Debit Balances 1,507 1,494 1,145 1,281 1,294<br />
Inventories 353 304 327 380 298<br />
Investments 53 0 302 828 1,128<br />
Properties, Plant & Equipment 1,407 1,334 1,250 1,978 2,305<br />
Total Assets 4,419 4,293 4,228 5,094 5,674<br />
Accounts Payable & Other Credit Balances 258 253 228 378 377<br />
Loans and Bank Facilities 0 102 0 549 640<br />
Other Liabilities 260 128 199 220 260<br />
Total Liabilities 518 483 427 1,148 1,276<br />
Equity 3,900 3,810 3,800 3,946 4,398<br />
Sales 2,249 2,397 2,760 2,583 2,813<br />
Cost of Sales 1,470 1,841 2,139 1,872 2,022<br />
Gross Profit 779 556 621 711 791<br />
Operating Expenses 258 313 309 319 350<br />
Operating Profit 521 243 313 392 441<br />
Finance Charges 20 7 11 9 13<br />
Other Non-operating Income 34 114 50 55 429<br />
Other Non-operating Expenses 41 46 46 56 89<br />
Net Profit 494 303 306 382 767<br />
Key Ratios<br />
KAMCO Research<br />
June 22, 2008<br />
2003 2004 2005 2006 2007<br />
Return On Assets 11.2% 7.1% 7.2% 7.5% 13.5%<br />
Return On Equity 12.7% 8.0% 8.0% 9.7% 17.4%<br />
Gross Profit Margin 34.6% 23.2% 22.5% 27.5% 28.1%<br />
Operating Profit Margin 23.2% 10.1% 11.3% 15.2% 15.7%<br />
Net Profit Margin 22.0% 12.7% 11.1% 14.8% 27.3%<br />
Current Ratio (X) 11.46<br />
8.33<br />
13.04<br />
3.36<br />
3.32<br />
Equity / Total Assets 88.3% 88.7% 89.9% 77.5% 77.5%<br />
Historical Share Data YTD<br />
2004 2005 2006 2007 22-Jun-08<br />
Market Capitalization (KD thousand) 8,925 7,744 6,038 9,188 10,106<br />
Closing Share Price (KD) 0.340 0.295 0.230 0.350 0.385<br />
Highest Price for the Period (KD) 0.405 0.345 0.315 0.455 0.385<br />
Lowest Price for the Period (KD) 0.280 0.255 0.230 0.218 0.260<br />
Volume (Shares thousand) 18,760 750 550 6,070 1,270<br />
Value (KD thousand) 6,381 213 145 1,974 388<br />
No. of Trades 408 73 29 309 74<br />
EPS (KD) 0.012 0.012 0.015 0.029 0.029<br />
Book Value Per Share (KD) 0.145 0.145 0.150 0.168 0.168<br />
Dividend Per Share (KD) 0.012 0.009 0.012 0.015 NA<br />
Price to Earnings Multiple (X) #<br />
33.33 33.08 26.48 13.17 13.17<br />
Price to Book Value Multiple (X) #<br />
2.65 2.66 2.56 2.30 2.30<br />
Dividend Yield (%) #<br />
3.12 2.34 3.12 3.90 3.90<br />
KD<br />
0.465<br />
0.435<br />
0.405<br />
0.375<br />
0.345<br />
0.315<br />
0.285<br />
0.255<br />
0.225<br />
52-Week Price Chart Rel. to KAMCO TRW Index<br />
KBMMC KAMCO TRW Index<br />
24.6.07<br />
8.7.07<br />
22.7.07<br />
5.8.07<br />
19.8.07<br />
2.9.07<br />
16.9.07<br />
30.9.07<br />
14.10.07<br />
28.10.07<br />
11.11.07<br />
25.11.07<br />
9.12.07<br />
23.12.07<br />
6.1.08<br />
20.1.08<br />
3.2.08<br />
17.2.08<br />
2.3.08<br />
16.3.08<br />
30.3.08<br />
13.4.08<br />
27.4.08<br />
11.5.08<br />
25.5.08<br />
8.6.08<br />
22.6.08<br />
Index<br />
4,800<br />
4,700<br />
4,600<br />
4,500<br />
4,400<br />
4,300<br />
4,200<br />
4,100<br />
4,000<br />
NA: Not Applicable, NM: Not Meaningful<br />
N/A: Not Available. YTD: Beginning of year to date<br />
#<br />
:Historical P/E, P/B & Yield are based on<br />
current price & historical earning per share,<br />
book value per share & dividend per share<br />
Investment Research Department<br />
KIPCO Asset Management Co.K.S.C.C<br />
KAMCO<br />
P.O.Box: 28873 Safat 13149 <strong>Kuwait</strong><br />
Email : kamco_research@kamconline.com


