

Kuwait Corporate Fact Sheet
Kuwait Corporate Fact Sheet
Kuwait Corporate Fact Sheet

Create successful ePaper yourself
Turn your PDF publications into a flip-book with our unique Google optimized e-Paper software.
The Investment Dar <strong>Fact</strong> <strong>Sheet</strong><br />
Investment Sector<br />
Reuters Code: TIDK.KW Current Price (KD) :<br />
June 22, 2008<br />
0.880<br />
Key <strong>Fact</strong>s<br />
KAMCO Research<br />
KD ' 000 2003 2004 2005 2006 2007<br />
Cash & Cash Equivalents 19,836 26,175 27,352 114,211 33,386<br />
Trade Receivables 169,775 189,453 161,802 197,927 130,327<br />
Prepayments & Other Debit Balances 12,036 18,284 71,914 54,158 62,673<br />
Murabaha Investments 537 540 14,302 64,157 173,373<br />
Investments Held for Trading 2,631<br />
37,811<br />
114,509<br />
131,805<br />
81,731<br />
Investments Available for Sale 9,402 5,346 127,345 221,414 141,945<br />
Investments in Real Estates 24,114 26,219 66,919 80,830 113,404<br />
Land & Real Estate Under Development 28,269 22,612 24,196 38,252 3,581<br />
Investments in Associates & Unconsolidated Subsid. 807 990 52,945 138,816 519,925<br />
Other Assets 3,087 7,024 8,346 19,209 21,897<br />
Total Assets 270,494 334,453 669,629 1,060,779 1,282,242<br />
Trade Payables & Other Credit Balances 18,364 10,020 114,635 21,105 54,464<br />
Murabaha & Wakala Payables 183,893 209,185 331,796 598,401 760,342<br />
Islamic Sokouks 0 0 28,573.26<br />
66,196.38<br />
55,859.75<br />
Other Liabilities 498 700 789 1,449 1,324<br />
Total Liabilities 202,754 219,906 475,793 687,152 871,989<br />
Minority Interest 288<br />
2,742<br />
16,820<br />
64,487<br />
38,021<br />
Equity 67,452 111,805 177,015 309,140 372,232<br />
Income from Financing Activities 13,944 14,468 20,118 31,671 27,621<br />
Management, Placement, & Advisory Fees 1,325 6,093 16,550 27,986 17,241<br />
Realized Investment Income 11,121 26,699 45,643 90,497 154,359<br />
Unrealized Investment Income 7,296 5,396 38,500 12,419 21,125<br />
Total Income 33,686 52,657 120,811 162,573 220,345<br />
Financing Costs 11,267 14,119 17,884 40,931 61,436<br />
General & Administrative Expenses 5,131 8,056 12,498 19,085 23,446<br />
Provision for Doubtful Debts 3,218 2,194 2,825 5,251 2,960<br />
Operating Profit 14,070 28,288 87,605 97,306 132,504<br />
Minority Interest 16.25<br />
416.15<br />
5,007.68<br />
2,382.75<br />
2,257.77<br />
Other Expenses 1,153 924 2,106 2,916 4,380<br />
Net Profit<br />
Key Ratios<br />
12,901 26,948 80,491 92,007 125,866<br />
2003 2004 2005 2006 2007<br />
Return On Assets 4.8% 8.1% 12.0% 8.7% 9.8%<br />
Return On Equity 19.1% 24.1% 45.5% 29.8% 33.8%<br />
Mgmt., Placement, & Advisory Fees/ Total Op. Income 3.9% 11.6% 13.7% 17.2% 7.8%<br />
Income From Financing Acitivties / Total Op. Income 41.4% 27.5% 16.7% 19.5% 12.5%<br />
Total Investment Income / Total Op. Income 54.7% 61.0% 69.6% 63.3% 79.6%<br />
Realized Investment Income / Total Inv. Income 60.4% 83.2% 54.2% 87.9% 88.0%<br />
Total Liabilities / Total Assets 75.0% 65.8% 71.1% 64.8% 68.0%<br />
Historical Share Data YTD<br />
2004 2005 2006 2007 22-Jun-08<br />
Market Capitalization (KD thousand) 299,242 902,798 894,683 778,587 839,653<br />
Closing Share Price (KD) 0.590 1.780 1.260 1.020 0.880<br />
Highest Price for the Period (KD) 0.600 2.040 1.900 1.340 1.320<br />
Lowest Price for the Period (KD) 0.320 0.580 1.040 0.930 0.850<br />
Volume (Shares thousand) 674,760 433,950 179,970 412,785 237,585<br />
Value (KD thousand) 307,491 504,260 253,518 462,476 256,877<br />
No. of Trades 17,077 21,996 14,669 32,792 12,964<br />
EPS (KD) 0.056 0.125 0.138 0.167 0.167<br />
Book Value Per Share (KD) 0.221 0.352 0.442 0.496 0.496<br />
Dividend Per Share (KD) 0.025 0.035 0.050 0.070 N/A<br />
Price to Earnings Multiple (X) #<br />
15.86 7.06 6.36 5.28 5.28<br />
Price to Book Value Multiple (X) #<br />
3.98 2.50 1.99 1.77 1.77<br />
Dividend Yield (%) #<br />
2.84 3.98 5.68 7.95 7.95<br />
KD<br />
1.350<br />
1.275<br />
1.200<br />
1.125<br />
1.050<br />
0.975<br />
0.900<br />
0.825<br />
24.6.07<br />
8.7.07<br />
22.7.07<br />
5.8.07<br />
19.8.07<br />
2.9.07<br />
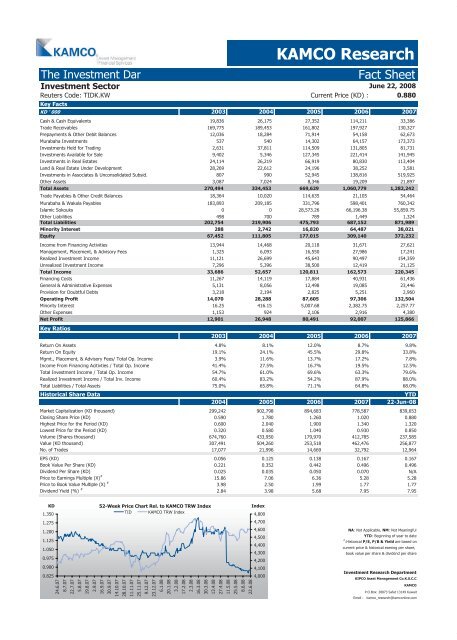
52-Week Price Chart Rel. to KAMCO TRW Index<br />
TID KAMCO TRW Index<br />
16.9.07<br />
30.9.07<br />
14.10.07<br />
28.10.07<br />
11.11.07<br />
25.11.07<br />
9.12.07<br />
23.12.07<br />
6.1.08<br />
20.1.08<br />
3.2.08<br />
17.2.08<br />
2.3.08<br />
16.3.08<br />
30.3.08<br />
13.4.08<br />
27.4.08<br />
11.5.08<br />
25.5.08<br />
8.6.08<br />
22.6.08<br />
Index<br />
4,800<br />
4,700<br />
4,600<br />
4,500<br />
4,400<br />
4,300<br />
4,200<br />
4,100<br />
4,000<br />
NA: Not Applicable, NM: Not Meaningful<br />
YTD: Beginning of year to date<br />
#<br />
:Historical P/E, P/B & Yield are based on<br />
current price & historical earning per share,<br />
book value per share & dividend per share<br />
Investment Research Department<br />
KIPCO Asset Management Co.K.S.C.C<br />
KAMCO<br />
P.O.Box: 28873 Safat 13149 <strong>Kuwait</strong><br />
Email : kamco_research@kamconline.com


