

Kuwait Corporate Fact Sheet
Kuwait Corporate Fact Sheet
Kuwait Corporate Fact Sheet

Create successful ePaper yourself
Turn your PDF publications into a flip-book with our unique Google optimized e-Paper software.
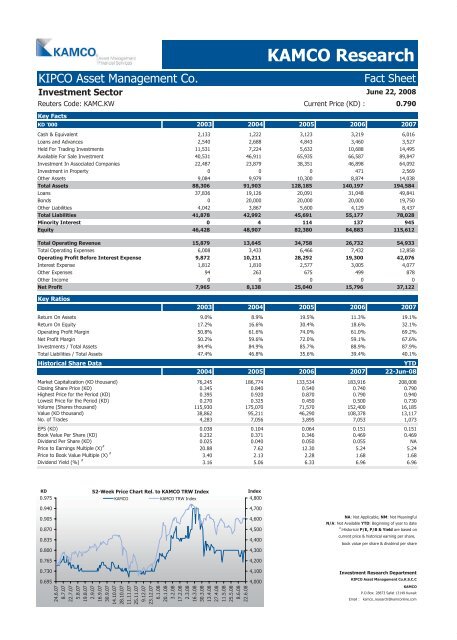
KIPCO Asset Management Co. <strong>Fact</strong> <strong>Sheet</strong><br />
Investment Sector<br />
Reuters Code: KAMC.KW Current Price (KD) : 0.790<br />
Key <strong>Fact</strong>s<br />
KD '000 2003 2004 2005 2006 2007<br />
Cash & Equivalent 2,133 1,222 3,123 3,219 6,016<br />
Loans and Advances 2,540 2,688 4,843 3,460 3,527<br />
Held For Trading Investments 11,531 7,224 5,632 10,688 14,495<br />
Available For Sale Investment 40,531 46,911 65,935 66,587 89,847<br />
Investment In Associated Companies 22,487 23,879 38,351 46,898 64,092<br />
Investment in Property 0 0 0 471 2,569<br />
Other Assets 9,084 9,979 10,300 8,874 14,038<br />
Total Assets 88,306 91,903 128,185 140,197 194,584<br />
Loans 37,836 19,126 20,091 31,048 49,841<br />
Bonds 0 20,000 20,000 20,000 19,750<br />
Other Liabilities 4,042 3,867 5,600 4,129 8,437<br />
Total Liabilities 41,878 42,992 45,691 55,177 78,028<br />
Minority Interest 0 4 114 137 945<br />
Equity 46,428 48,907 82,380 84,883 115,612<br />
Total Operating Revenue 15,879 13,645 34,758 26,732 54,933<br />
Total Operating Expenses 6,008 3,433 6,466 7,432 12,858<br />
Operating Profit Before Interest Expense 9,872 10,211 28,292 19,300 42,076<br />
Interest Expense 1,812 1,810 2,577 3,005 4,077<br />
Other Expenses 94 263 675 499 878<br />
Other Income 0 0 0 0 0<br />
Net Profit 7,965 8,138 25,040 15,796 37,122<br />
Key Ratios<br />
KAMCO Research<br />
June 22, 2008<br />
2003 2004 2005 2006 2007<br />
Return On Assets 9.0% 8.9% 19.5% 11.3% 19.1%<br />
Return On Equity 17.2% 16.6% 30.4% 18.6% 32.1%<br />
Operating Profit Margin 50.8% 61.6% 74.0% 61.0% 69.2%<br />
Net Profit Margin 50.2% 59.6% 72.0% 59.1% 67.6%<br />
Investments / Total Assets 84.4% 84.9% 85.7% 88.9% 87.9%<br />
Total Liabilities / Total Assets 47.4% 46.8% 35.6% 39.4% 40.1%<br />
Historical Share Data YTD<br />
2004 2005 2006 2007 22-Jun-08<br />
Market Capitalization (KD thousand) 76,245 186,774 133,534 183,916 208,008<br />
Closing Share Price (KD) 0.345 0.840 0.540 0.740 0.790<br />
Highest Price for the Period (KD) 0.395 0.920 0.870 0.790 0.940<br />
Lowest Price for the Period (KD) 0.270 0.325 0.450 0.500 0.730<br />
Volume (Shares thousand) 115,930 175,070 71,570 152,400 16,185<br />
Value (KD thousand) 38,862 95,211 46,290 108,378 13,117<br />
No. of Trades 4,283 7,056 3,895 7,053 1,073<br />
EPS (KD) 0.038 0.104 0.064 0.151 0.151<br />
Book Value Per Share (KD) 0.232 0.371 0.346 0.469 0.469<br />
Dividend Per Share (KD) 0.025 0.040 0.050 0.055 NA<br />
Price to Earnings Multiple (X) #<br />
20.88 7.62 12.30 5.24 5.24<br />
Price to Book Value Multiple (X) #<br />
3.40 2.13 2.28 1.68 1.68<br />
Dividend Yield (%) #<br />
3.16 5.06 6.33 6.96 6.96<br />
KD<br />
0.975<br />
0.940<br />
0.905<br />
0.870<br />
0.835<br />
0.800<br />
0.765<br />
0.730<br />
0.695<br />
52-Week Price Chart Rel. to KAMCO TRW Index<br />
KAMCO KAMCO TRW Index<br />
24.6.07<br />
8.7.07<br />
22.7.07<br />
5.8.07<br />
19.8.07<br />
2.9.07<br />
16.9.07<br />
30.9.07<br />
14.10.07<br />
28.10.07<br />
11.11.07<br />
25.11.07<br />
9.12.07<br />
23.12.07<br />
6.1.08<br />
20.1.08<br />
3.2.08<br />
17.2.08<br />
2.3.08<br />
16.3.08<br />
30.3.08<br />
13.4.08<br />
27.4.08<br />
11.5.08<br />
25.5.08<br />
8.6.08<br />
22.6.08<br />
Index<br />
4,800<br />
4,700<br />
4,600<br />
4,500<br />
4,400<br />
4,300<br />
4,200<br />
4,100<br />
4,000<br />
NA: Not Applicable, NM: Not Meaningful<br />
N/A: Not Available YTD: Beginning of year to date<br />
#<br />
:Historical P/E, P/B & Yield are based on<br />
current price & historical earning per share,<br />
book value per share & dividend per share<br />
Investment Research Department<br />
KIPCO Asset Management Co.K.S.C.C<br />
KAMCO<br />
P.O.Box: 28873 Safat 13149 <strong>Kuwait</strong><br />
Email : kamco_research@kamconline.com


