

Kuwait Corporate Fact Sheet
Kuwait Corporate Fact Sheet
Kuwait Corporate Fact Sheet

Create successful ePaper yourself
Turn your PDF publications into a flip-book with our unique Google optimized e-Paper software.
First Takaful Insurance Co. <strong>Fact</strong> <strong>Sheet</strong><br />
Insurance Sector<br />
KAMCO Research<br />
Reuters Code: FTIK.KW Current Price (KD) :<br />
June 22, 2008<br />
0.400<br />
Key <strong>Fact</strong>s<br />
KD '000 2003 2004] 2005 2006 2007<br />
Cash & Equivalent 0 1 1 1 1<br />
Murabaha & Ijara Receivables 129 0 0 0 0<br />
Available for Sale Investments 5,548 6,304 13,452 10,926 11,929<br />
Investments in Associates 0 0 0 1,692 1,779<br />
Receivables from Insurance Policy Holders 0 0 75 0 87<br />
Qard Hasan to Insurance Policy Holders 190 0 0 0 0<br />
Other Investments 165 204 147 152 152<br />
Other Assets 1,425 2,210 2,210 2,107 1,960<br />
Total Assets 7,456 8,719 15,885 14,878 15,908<br />
Unearned Premiums Reserves 190 0 0 0 0<br />
Payables to Insurance Policy Holders 109 1,257 0 296 0<br />
Other Payables 496 46 112 228 244<br />
Total Liabilities 795 1,304 112 524 244<br />
Equity 6,661 7,416 15,773 14,354 15,664<br />
Shareholders' Share of Insurance Surplus 0 0 120 451 456<br />
Management Fees 0 0 212 468 417<br />
Net Investment Income (NII) 485 855 1,994 1,336 1,379<br />
Total Operating Revenues 485 855 2,326 2,255 2,251<br />
Operating Expenses 0 71 119 148 202<br />
Operating Profit 485 784 2,208 2,107 2,050<br />
Other Income 0 22 1 6 0<br />
Other Expenses 39 76 130 120 138<br />
Net Profit 446 730 2,079 1,993 1,912<br />
Key Ratios<br />
2003 2004 2005 2006 2007<br />
Return On Assets 6.0% 8.4% 13.1% 13.4% 12.0%<br />
Return On Equity 6.7% 9.8% 13.2% 13.9% 12.2%<br />
Net Investment Income / Net Invested Assets 8.3% 13.1% 14.7% 10.5% 9.9%<br />
Invested Assets / Total Assets 76.6% 74.6% 85.6% 85.8% 87.1%<br />
Equity / Total Assets 89.3% 85.0% 99.3% 96.5% 98.5%<br />
Historical Share Data* YTD<br />
2004 2005 2006 2007 22-Jun-08<br />
Market Capitalization (KD thousand) 33,500 38,000 39,500 39,000 40,000<br />
Closing Share Price (KD) 0.335 0.380 0.395 0.390 0.400<br />
Highest Price for the Period (KD) 0.355 0.415 0.400 0.420 0.540<br />
Lowest Price for the Period (KD) 0.255 0.230 0.360 0.320 0.350<br />
Volume (Shares thousand) 15,960 44,330 3,980 120 3,550<br />
Value (KD thousand) 5,073 13,971 1,495 46 1,406<br />
No. of Trades 589 572 38 11 38<br />
EPS (KD) 0.015 0.026 0.020 0.019 0.019<br />
Book Value Per Share (KD) 0.148 0.158 0.144 0.157 0.157<br />
Dividend Per Share (KD) 0.012 0.018 0.018 0.018 NA<br />
Price to Earnings Multiple (X) #<br />
27.40 15.53 20.07 20.93 20.93<br />
Price to Book Value Multiple (X) #<br />
2.70 2.54 2.79 2.55 2.55<br />
Dividend Yield (%) #<br />
3.00 4.50 4.50 4.50 4.50<br />
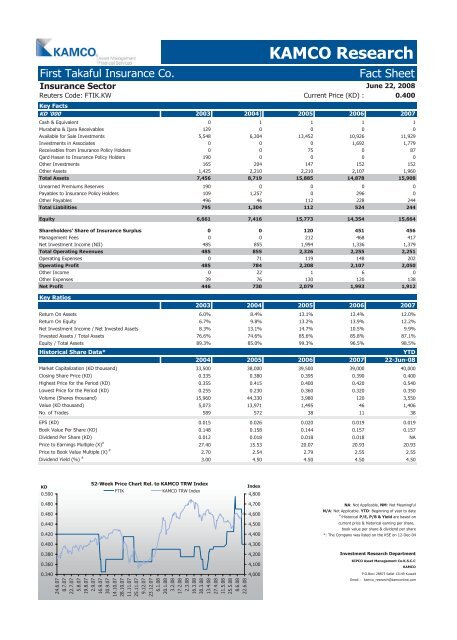
KD<br />
0.500<br />
0.480<br />
0.460<br />
0.440<br />
0.420<br />
0.400<br />
0.380<br />
0.360<br />
0.340<br />
52-Week Price Chart Rel. to KAMCO TRW Index<br />
FTIK KAMCO TRW Index<br />
24.6.07<br />
8.7.07<br />
22.7.07<br />
5.8.07<br />
19.8.07<br />
2.9.07<br />
16.9.07<br />
30.9.07<br />
14.10.07<br />
28.10.07<br />
11.11.07<br />
25.11.07<br />
9.12.07<br />
23.12.07<br />
6.1.08<br />
20.1.08<br />
3.2.08<br />
17.2.08<br />
2.3.08<br />
16.3.08<br />
30.3.08<br />
13.4.08<br />
27.4.08<br />
11.5.08<br />
25.5.08<br />
8.6.08<br />
22.6.08<br />
Index<br />
4,800<br />
4,700<br />
4,600<br />
4,500<br />
4,400<br />
4,300<br />
4,200<br />
4,100<br />
4,000<br />
NA: Not Applicable, NM: Not Meaningful<br />
N/A: Not Applicable. YTD: Beginning of year to date<br />
#<br />
:Historical P/E, P/B & Yield are based on<br />
current price & historical earning per share,<br />
book value per share & dividend per share<br />
*: The Company was listed on the KSE on 12-Dec-04<br />
Investment Research Department<br />
KIPCO Asset Management Co.K.S.C.C<br />
KAMCO<br />
P.O.Box: 28873 Safat 13149 <strong>Kuwait</strong><br />
Email : kamco_research@kamconline.com


