

Kuwait Corporate Fact Sheet
Kuwait Corporate Fact Sheet
Kuwait Corporate Fact Sheet

Create successful ePaper yourself
Turn your PDF publications into a flip-book with our unique Google optimized e-Paper software.
National Co. for Consumer Industries <strong>Fact</strong> <strong>Sheet</strong><br />
Industrial Sector<br />
Reuters Code: NCCI.KW Current Price (KD) : 0.330<br />
Key <strong>Fact</strong>s<br />
KD '000 2003 2004 2005 2006 2007<br />
Cash & Equivalent 60 40 167 199 5<br />
Accounts Receivable & Other Debit Balances 4,348 3,106 429 128 7,119<br />
Investments 2,000 3,700 3,700 78 78<br />
Property, Plant & Equipment 96 685 3,941 10,421 5<br />
Total Assets 6,504 7,531 8,238 10,826 7,206<br />
Accounts Payable & Other Credit Balances 124 345 586 913 209<br />
Loans 2,850 2,850 2,850 4,911 0<br />
Other Liabilities 4 7 11 10 7<br />
Total Liabilities 2,978 3,202 3,448 5,834 216<br />
Minority Interest 195 267 322 390 0<br />
Equity 3,331 4,062 4,468 4,601 6,990<br />
Operating Revenues 2,233 914 883 1,499 3,454<br />
Operating Costs 237 300 315 406 675<br />
Operating Profit 1,995 615 567 1,093 2,778<br />
Finance Charges 21 191 239 395 304<br />
Other Non-operating Income 422 386 137 107 66<br />
Other Non-operating Expenses 314 78 59 130 150<br />
Net Profit 2,083 732 406 675 2,390<br />
Key Ratios<br />
KAMCO Research<br />
June 22, 2008<br />
2003 2004 2005 2006 2007<br />
Return On Assets 32.0% 9.7% 4.9% 6.2% 33.2%<br />
Return On Equity 62.5% 18.0% 9.1% 14.7% 34.2%<br />
Operating Profit Margin 89.4% 67.2% 64.3% 72.9% 80.4%<br />
Net Profit Margin 93.3% 80.0% 45.9% 45.0% 69.2%<br />
Debt / Equity 85.6% 70.2% 63.8% 106.7% 0.0%<br />
Historical Share Data* YTD<br />
2004 2005 2006 2007 22-Jun-08<br />
Market Capitalization (KD thousand) N/A N/A 15,600 15,300 29,700<br />
Closing Share Price (KD) N/A N/A 0.520 0.510 0.330<br />
Highest Price for the Period (KD) N/A N/A 0.560 0.550 0.510<br />
Lowest Price for the Period (KD) N/A N/A 0.520 0.500 0.190<br />
Volume (Shares thousand) N/A N/A 60 865 186,790<br />
Value (KD thousand) N/A N/A 33 462 52,425<br />
No. of Trades N/A N/A 8 50 5,717<br />
EPS (KD) 0.024 0.014 0.023 0.080 0.080<br />
Book Value Per Share (KD) 0.135 0.149 0.153 0.233 0.233<br />
Dividend Per Share (KD) 0.000 0.000 0.000 0.110 NA<br />
Price to Earning Multiple (X) #<br />
13.52 24.41 14.66 4.15 4.15<br />
Price to Book Value Multiple (X) #<br />
2.44 2.22 2.15 1.42 1.42<br />
Dividend Yield (%) #<br />
0.00 0.00 0.00 33.46 33.46<br />
KD<br />
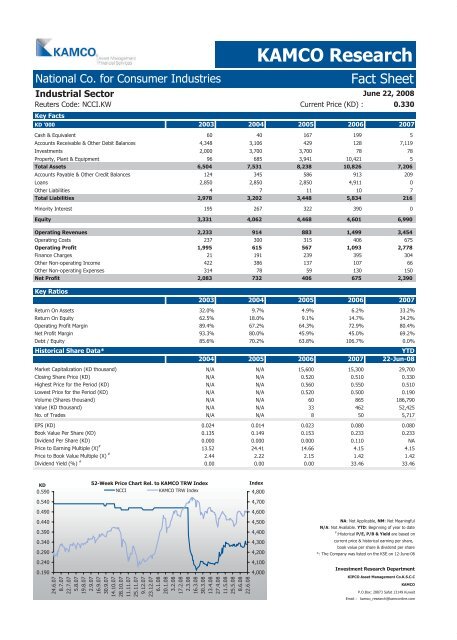
0.590<br />
0.540<br />
0.490<br />
0.440<br />
0.390<br />
0.340<br />
0.290<br />
0.240<br />
0.190<br />
52-Week Price Chart Rel. to KAMCO TRW Index<br />
NCCI KAMCO TRW Index<br />
24.6.07<br />
8.7.07<br />
22.7.07<br />
5.8.07<br />
19.8.07<br />
2.9.07<br />
16.9.07<br />
30.9.07<br />
14.10.07<br />
28.10.07<br />
11.11.07<br />
25.11.07<br />
9.12.07<br />
23.12.07<br />
6.1.08<br />
20.1.08<br />
3.2.08<br />
17.2.08<br />
2.3.08<br />
16.3.08<br />
30.3.08<br />
13.4.08<br />
27.4.08<br />
11.5.08<br />
25.5.08<br />
8.6.08<br />
22.6.08<br />
Index<br />
4,800<br />
4,700<br />
4,600<br />
4,500<br />
4,400<br />
4,300<br />
4,200<br />
4,100<br />
4,000<br />
NA: Not Applicable, NM: Not Meaningful<br />
N/A: Not Available. YTD: Beginning of year to date<br />
#<br />
:Historical P/E, P/B & Yield are based on<br />
current price & historical earning per share,<br />
book value per share & dividend per share<br />
*: The Company was listed on the KSE on 12-June-06<br />
Investment Research Department<br />
KIPCO Asset Management Co.K.S.C.C<br />
KAMCO<br />
P.O.Box: 28873 Safat 13149 <strong>Kuwait</strong><br />
Email : kamco_research@kamconline.com


