

Kuwait Corporate Fact Sheet
Kuwait Corporate Fact Sheet
Kuwait Corporate Fact Sheet

Create successful ePaper yourself
Turn your PDF publications into a flip-book with our unique Google optimized e-Paper software.
Al Safat Tec Holding Company <strong>Fact</strong> <strong>Sheet</strong><br />
Services Sector<br />
Reuters Code: ATGK.KW Current Price (KD) : 0.156<br />
Key <strong>Fact</strong>s<br />
KD '000 2003 2004 2005 2006 2007<br />
Cash & Equivalent 1 53 176 472 1,373<br />
Accounts Receivable & Other Debit Balances 91 1,641 5,686 8,633 20,533<br />
Inventories 78 1,318 2,203 4,287 8,311<br />
Investments 0 310 595 594 21,619<br />
Other Assets 0 479 993 4,884 23,579<br />
Total Assets 170 3,801 9,653 18,869 75,413<br />
Accounts Payable & Other Credit Balances 45 2,353 3,023 3,564 4,853<br />
Loans Payable 0 0 0 6,691 14,280<br />
Other Liabilities 8 346 506 804 6,710<br />
Total Liabilities 53 2,699 3,529 11,060 25,842<br />
Minority Interest 0 0 0 512 628<br />
Equity 117 1,101 6,123 7,297 48,943<br />
Sales 186 2,486 10,323 20,459 28,084<br />
Cost of Revenues 151 1,962 7,702 15,749 20,635<br />
Gross Profit 35 524 2,621 4,711 7,449<br />
Operating Expenses 33 242 1,934 3,867 5,939<br />
Operating Profit (Loss) 2 282 687 844 1,510<br />
Investment Income 0 0 184 423 1,613<br />
Other Non-operating Income 0 20 89 410 686<br />
Other Non-operating Expenses 0 3 28 504 801<br />
Net Profit 2 299 933 1,173 3,008<br />
Key Ratios<br />
KAMCO Research<br />
June 22, 2008<br />
2003 2004 2005 2006 2007<br />
Return On Assets 1.1% 7.9% 9.7% 6.2% 4.0%<br />
Return On Equity 1.6% 27.1% 15.2% 16.1% 6.1%<br />
Gross Profit Margin 18.8% 21.1% 25.4% 23.0% 26.5%<br />
Operating Profit Margin 1.0% 11.3% 6.7% 4.1% 5.4%<br />
Net Profit Margin 1.0% 12.0% 9.0% 5.7% 10.7%<br />
Total Liabilities / Total Assets 31.3% 71.0% 36.6% 58.6% 34.3%<br />
Investments / Total Assets 0.0% 8.2% 6.2% 3.1% 28.7%<br />
Historical Share Data* YTD<br />
2004 2005 2006 2007 22-Jun-08<br />
Market Capitalization (KD thousand) N/A N/A 15,938 68,800 62,400<br />
Closing Share Price (KD) N/A N/A 0.425 0.172 0.156<br />
Highest Price For the Period (KD) N/A N/A 0.560 0.460 0.198<br />
Lowest Price For the Period (KD) N/A N/A 0.330 0.134 0.150<br />
Volume (Shares thousand) N/A N/A 26,315 115,890 396,440<br />
Value (KD thousand) N/A N/A 11,256 21,466 67,731<br />
No. of Trades N/A N/A 583 2,562 7,158<br />
EPS (KD) 0.136 0.028 0.018 0.012 0.012<br />
Book Value Per Share (KD) 0.140 0.163 0.195 0.122 0.122<br />
Dividend Per Share (KD) 0.000 0.000 0.000 0.000 NA<br />
Price to Earnings Multiple (X) #<br />
1.15 5.57 8.61 12.63 12.63<br />
Price to Book Value Multiple (X) #<br />
1.11 0.96 0.80 1.27 1.27<br />
Dividend Yield (%) #<br />
0.00 0.00 0.00 0.00 0.00<br />
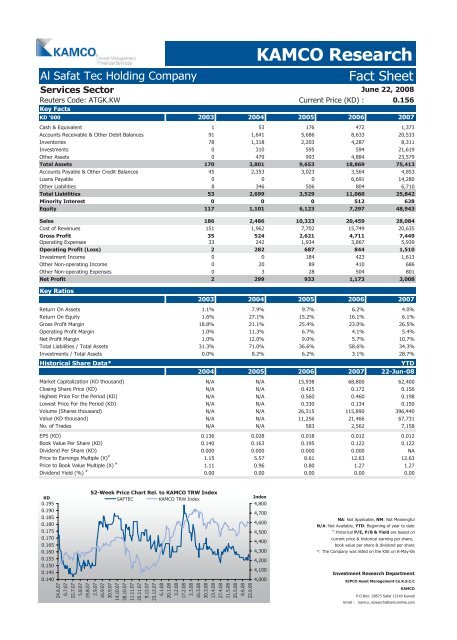
KD<br />
0.195<br />
0.190<br />
0.185<br />
0.180<br />
0.175<br />
0.170<br />
0.165<br />
0.160<br />
0.155<br />
0.150<br />
0.145<br />
0.140<br />
52-Week Price Chart Rel. to KAMCO TRW Index<br />
SAFTEC KAMCO TRW Index<br />
24.6.07<br />
8.7.07<br />
22.7.07<br />
5.8.07<br />
19.8.07<br />
2.9.07<br />
16.9.07<br />
30.9.07<br />
14.10.07<br />
28.10.07<br />
11.11.07<br />
25.11.07<br />
9.12.07<br />
23.12.07<br />
6.1.08<br />
20.1.08<br />
3.2.08<br />
17.2.08<br />
2.3.08<br />
16.3.08<br />
30.3.08<br />
13.4.08<br />
27.4.08<br />
11.5.08<br />
25.5.08<br />
8.6.08<br />
22.6.08<br />
Index<br />
4,800<br />
4,700<br />
4,600<br />
4,500<br />
4,400<br />
4,300<br />
4,200<br />
4,100<br />
4,000<br />
NA: Not Applicable, NM: Not Meaningful<br />
N/A: Not Available, YTD: Beginning of year to date<br />
#<br />
:Historical P/E, P/B & Yield are based on<br />
current price & historical earning per share,<br />
book value per share & dividend per share<br />
*: The Company was listed on the KSE on 8-May-06<br />
Investment Research Department<br />
KIPCO Asset Management Co.K.S.C.C<br />
KAMCO<br />
P.O.Box: 28873 Safat 13149 <strong>Kuwait</strong><br />
Email : kamco_research@kamconline.com


