The Status of Nepal's Mammals: The National Red List Series - IUCN
The Status of Nepal's Mammals: The National Red List Series - IUCN
The Status of Nepal's Mammals: The National Red List Series - IUCN

Create successful ePaper yourself
Turn your PDF publications into a flip-book with our unique Google optimized e-Paper software.
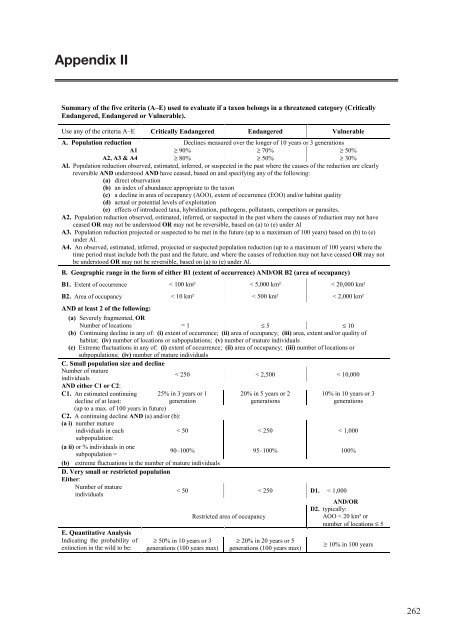
Appendix II<br />
Summary <strong>of</strong> the five criteria (A–E) used to evaluate if a taxon belongs in a threatened category (Critically<br />
Endangered, Endangered or Vulnerable).<br />
Use any <strong>of</strong> the criteria A–E Critically Endangered Endangered Vulnerable<br />
A. Population reduction Declines measured over the longer <strong>of</strong> 10 years or 3 generations<br />
A1 ≥ 90% ≥ 70% ≥ 50%<br />
A2, A3 & A4 ≥ 80% ≥ 50% ≥ 30%<br />
Al. Population reduction observed, estimated, inferred, or suspected in the past where the causes <strong>of</strong> the reduction are clearly<br />
reversible AND understood AND have ceased, based on and specifying any <strong>of</strong> the following:<br />
(a) direct observation<br />
(b) an index <strong>of</strong> abundance appropriate to the taxon<br />
(c) a decline in area <strong>of</strong> occupancy (AOO), extent <strong>of</strong> occurrence (EOO) and/or habitat quality<br />
(d) actual or potential levels <strong>of</strong> exploitation<br />
(e) effects <strong>of</strong> introduced taxa, hybridization, pathogens, pollutants, competitors or parasites.<br />
A2. Population reduction observed, estimated, inferred, or suspected in the past where the causes <strong>of</strong> reduction may not have<br />
ceased OR may not be understood OR may not be reversible, based on (a) to (e) under Al<br />
A3. Population reduction projected or suspected to be met in the future (up to a maximum <strong>of</strong> 100 years) based on (b) to (e)<br />
under Al.<br />
A4. An observed, estimated, inferred, projected or suspected population reduction (up to a maximum <strong>of</strong> 100 years) where the<br />
time period must include both the past and the future, and where the causes <strong>of</strong> reduction may not have ceased OR may not<br />
be understood OR may not be reversible, based on (a) to (e) under Al.<br />
B. Geographic range in the form <strong>of</strong> either B1 (extent <strong>of</strong> occurrence) AND/OR B2 (area <strong>of</strong> occupancy)<br />
B1. Extent <strong>of</strong> occurrence < 100 km² < 5,000 km² < 20,000 km²<br />
B2. Area <strong>of</strong> occupancy < 10 km² < 500 km² < 2,000 km²<br />
AND at least 2 <strong>of</strong> the following:<br />
(a) Severely fragmented, OR<br />
Number <strong>of</strong> locations = 1 ≤ 5 ≤ 10<br />
(b) Continuing decline in any <strong>of</strong>: (i) extent <strong>of</strong> occurrence; (ii) area <strong>of</strong> occupancy; (iii) area, extent and/or quality <strong>of</strong><br />
habitat; (iv) number <strong>of</strong> locations or subpopulations; (v) number <strong>of</strong> mature individuals<br />
(c) Extreme fluctuations in any <strong>of</strong>: (i) extent <strong>of</strong> occurrence; (ii) area <strong>of</strong> occupancy; (iii) number <strong>of</strong> locations or<br />
subpopulations; (iv) number <strong>of</strong> mature individuals<br />
C. Small population size and decline<br />
Number <strong>of</strong> mature<br />
individuals<br />
AND either C1 or C2:<br />
< 250 < 2,500 < 10,000<br />
C1. An estimated continuing 25% in 3 years or 1<br />
20% in 5 years or 2<br />
10% in 10 years or 3<br />
decline <strong>of</strong> at least:<br />
generation<br />
generations<br />
generations<br />
(up to a max. <strong>of</strong> 100 years in future)<br />
C2. A continuing decline AND (a) and/or (b):<br />
(a i) number mature<br />
individuals in each<br />
subpopulation:<br />
< 50 < 250 < 1,000<br />
(a ii) or % individuals in one<br />
subpopulation =<br />
90–100% 95–100% 100%<br />
(b) extreme fluctuations in the number <strong>of</strong> mature individuals<br />
D. Very small or restricted population<br />
Either:<br />
Number <strong>of</strong> mature<br />
individuals<br />
< 50 < 250 D1. < 1,000<br />
AND/OR<br />
Restricted area <strong>of</strong> occupancy<br />
D2. typically:<br />
AOO < 20 km² or<br />
number <strong>of</strong> locations ≤ 5<br />
E. Quantitative Analysis<br />
Indicating the probability <strong>of</strong><br />
extinction in the wild to be:<br />
≥ 50% in 10 years or 3<br />
generations (100 years max)<br />
≥ 20% in 20 years or 5<br />
generations (100 years max)<br />
≥ 10% in 100 years<br />
262