FONIX® 8000 - Frye Electronics
FONIX® 8000 - Frye Electronics
FONIX® 8000 - Frye Electronics

Create successful ePaper yourself
Turn your PDF publications into a flip-book with our unique Google optimized e-Paper software.
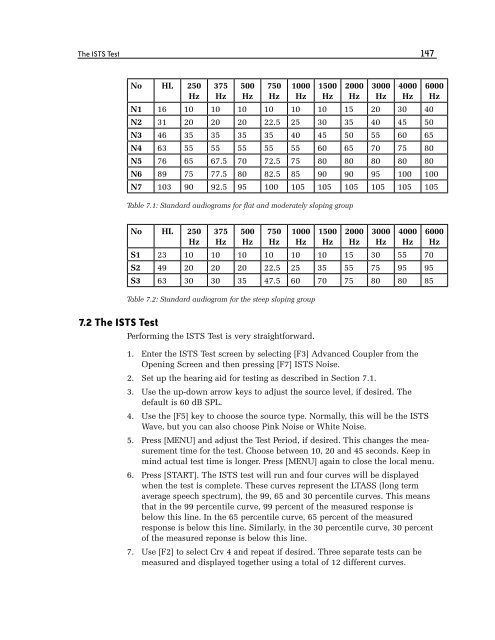
The ISTS Test 147<br />
No HL 250<br />
Hz<br />
375<br />
Hz<br />
500<br />
Hz<br />
750<br />
Hz<br />
1000<br />
Hz<br />
1500<br />
Hz<br />
2000<br />
Hz<br />
3000<br />
Hz<br />
4000<br />
Hz<br />
N1 16 10 10 10 10 10 10 15 20 30 40<br />
N2 31 20 20 20 22.5 25 30 35 40 45 50<br />
N3 46 35 35 35 35 40 45 50 55 60 65<br />
N4 63 55 55 55 55 55 60 65 70 75 80<br />
N5 76 65 67.5 70 72.5 75 80 80 80 80 80<br />
N6 89 75 77.5 80 82.5 85 90 90 95 100 100<br />
N7 103 90 92.5 95 100 105 105 105 105 105 105<br />
Table 7.1: Standard audiograms for flat and moderately sloping group<br />
No HL 250<br />
Hz<br />
375<br />
Hz<br />
500<br />
Hz<br />
750<br />
Hz<br />
1000<br />
Hz<br />
1500<br />
Hz<br />
2000<br />
Hz<br />
3000<br />
Hz<br />
4000<br />
Hz<br />
S1 23 10 10 10 10 10 10 15 30 55 70<br />
S2 49 20 20 20 22.5 25 35 55 75 95 95<br />
S3 63 30 30 35 47.5 60 70 75 80 80 85<br />
Table 7.2: Standard audiogram for the steep sloping group<br />
7.2 The ISTS Test<br />
Performing the ISTS Test is very straightforward.<br />
1. Enter the ISTS Test screen by selecting [F3] Advanced Coupler from the<br />
Opening Screen and then pressing [F7] ISTS Noise.<br />
2. Set up the hearing aid for testing as described in Section 7.1.<br />
3. Use the up-down arrow keys to adjust the source level, if desired. The<br />
default is 60 dB SPL.<br />
4. Use the [F5] key to choose the source type. Normally, this will be the ISTS<br />
Wave, but you can also choose Pink Noise or White Noise.<br />
5. Press [MENU] and adjust the Test Period, if desired. This changes the measurement<br />
time for the test. Choose between 10, 20 and 45 seconds. Keep in<br />
mind actual test time is longer. Press [MENU] again to close the local menu.<br />
6. Press [START]. The ISTS test will run and four curves will be displayed<br />
when the test is complete. These curves represent the LTASS (long term<br />
average speech spectrum), the 99, 65 and 30 percentile curves. This means<br />
that in the 99 percentile curve, 99 percent of the measured response is<br />
below this line. In the 65 percentile curve, 65 percent of the measured<br />
response is below this line. Similarly, in the 30 percentile curve, 30 percent<br />
of the measured reponse is below this line.<br />
7. Use [F2] to select Crv 4 and repeat if desired. Three separate tests can be<br />
measured and displayed together using a total of 12 different curves.<br />
6000<br />
Hz<br />
6000<br />
Hz