FONIX® 8000 - Frye Electronics
FONIX® 8000 - Frye Electronics
FONIX® 8000 - Frye Electronics

You also want an ePaper? Increase the reach of your titles
YUMPU automatically turns print PDFs into web optimized ePapers that Google loves.
38 FONIX <strong>8000</strong> Hearing Aid Test System<br />
2.3.2.1 Noise reduction<br />
Composite noise reduction is a little different than pure-tone noise reduction<br />
(discussed in Section 2.3.1.1), even though both are used for noisy testing environments.<br />
When a composite signal is running, the analyzer takes several different measurements<br />
a second and displays them on the screen. Composite noise reduction<br />
performs a “running average” of these composite measurements. This<br />
means it averages together several of the previous measurements with the current<br />
measurement to produce the next curve. If you select “2X” noise reduction,<br />
it will average the last two measurements together. A selection of “4X”<br />
averages the last four measurements together. When performing composite measurements,<br />
it will take several seconds for the actual noise reduction used to<br />
reach the set value. This is due to the nature of the running average.<br />
Larger noise reduction numbers lead to smoother curves but increase the<br />
amount of time it takes the analyzer to update its composite measurements.<br />
2.3.2.2 Intermodulation distortion<br />
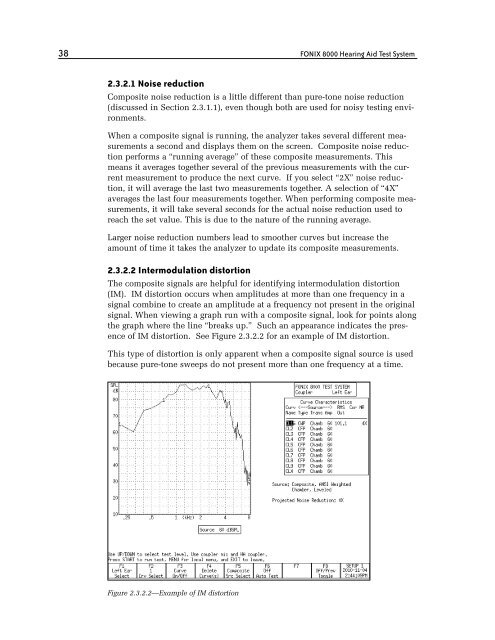
The composite signals are helpful for identifying intermodulation distortion<br />
(IM). IM distortion occurs when amplitudes at more than one frequency in a<br />
signal combine to create an amplitude at a frequency not present in the original<br />
signal. When viewing a graph run with a composite signal, look for points along<br />
the graph where the line “breaks up.” Such an appearance indicates the presence<br />
of IM distortion. See Figure 2.3.2.2 for an example of IM distortion.<br />
This type of distortion is only apparent when a composite signal source is used<br />
because pure-tone sweeps do not present more than one frequency at a time.<br />
Figure 2.3.2.2—Example of IM distortion