FONIX® 8000 - Frye Electronics
FONIX® 8000 - Frye Electronics
FONIX® 8000 - Frye Electronics

Create successful ePaper yourself
Turn your PDF publications into a flip-book with our unique Google optimized e-Paper software.
166 FONIX <strong>8000</strong> Hearing Aid Analyzer<br />
In other words, the bottom graph of the insertion gain screen shows the difference<br />
between the sound field measured by the reference microphone outside of<br />
the ear and the probe microphone in the ear canal. (When the reference microphone<br />
is disabled, the estimated sound field is subtracted.) The top graph shows<br />
the insertion gain, which are the values obtained when the unaided response is<br />
subtracted from the aided response.<br />
Target Curve A, displayed in the top graph in the Real-ear Insertion Gain screen,<br />
is automatically adjusted to the source type and amplitude of the current selected<br />
curve when REAG 2-5 are selected. When REUG 1 is selected, Target Curve<br />
A uses the source settings of REAG 3. (This only applies when the NAL-NL1 fitting<br />
rule is selected. All other fitting rules on the <strong>8000</strong> are linear, which means<br />
the target does not change with respect to the source type and amplitude of the<br />
signal.)<br />
Most of the operations of the Insertion Gain screen are identical to the operations<br />
of the Real-ear SPL screen. Therefore, most of the instructions found in<br />
this section apply to measurements performed in both screens. Any differences<br />
between operations in the two screens are noted.<br />
To enter the Insertion Gain screen, press [F2] from the Opening screen to enter<br />
the Real-ear Navigation screen. Then press [F3].<br />
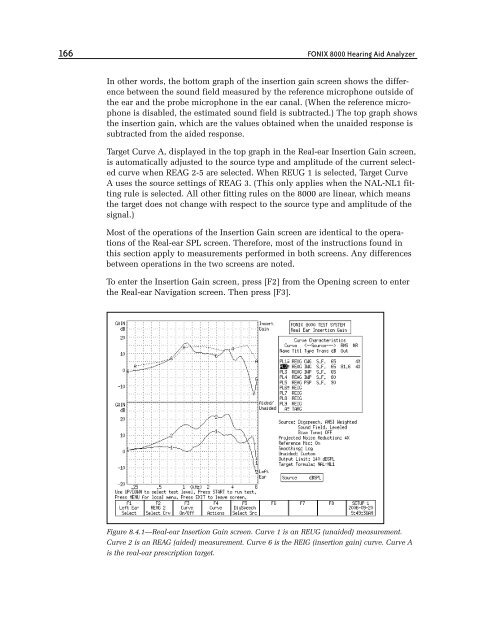
Figure 8.4.1—Real-ear Insertion Gain screen. Curve 1 is an REUG (unaided) measurement.<br />
Curve 2 is an REAG (aided) measurement. Curve 6 is the REIG (insertion gain) curve. Curve A<br />
is the real-ear prescription target.