FONIX® 8000 - Frye Electronics
FONIX® 8000 - Frye Electronics
FONIX® 8000 - Frye Electronics
Create successful ePaper yourself
Turn your PDF publications into a flip-book with our unique Google optimized e-Paper software.
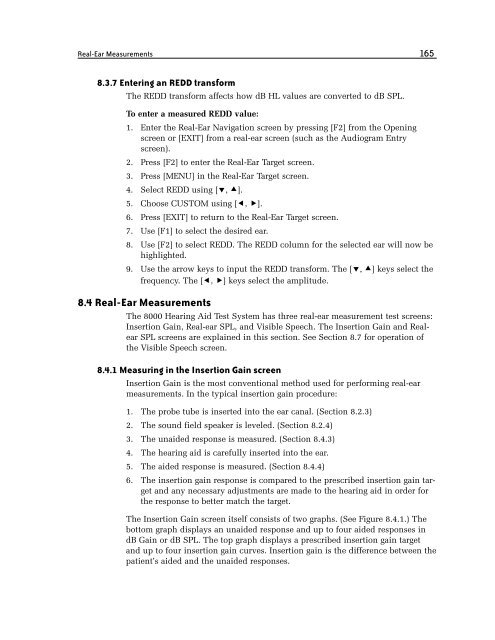
Real-Ear Measurements 165<br />
8.3.7 Entering an REDD transform<br />
The REDD transform affects how dB HL values are converted to dB SPL.<br />
to enter a measured reDD value:<br />
1. Enter the Real-Ear Navigation screen by pressing [F2] from the Opening<br />
screen or [EXIT] from a real-ear screen (such as the Audiogram Entry<br />
screen).<br />
2. Press [F2] to enter the Real-Ear Target screen.<br />
3. Press [MENU] in the Real-Ear Target screen.<br />
4. Select REDD using [, ].<br />
5. Choose CUSTOM using [, ].<br />
6. Press [EXIT] to return to the Real-Ear Target screen.<br />
7. Use [F1] to select the desired ear.<br />
8. Use [F2] to select REDD. The REDD column for the selected ear will now be<br />
highlighted.<br />
9. Use the arrow keys to input the REDD transform. The [, ] keys select the<br />
frequency. The [, ] keys select the amplitude.<br />
8.4 Real-Ear Measurements<br />
The <strong>8000</strong> Hearing Aid Test System has three real-ear measurement test screens:<br />
Insertion Gain, Real-ear SPL, and Visible Speech. The Insertion Gain and Realear<br />
SPL screens are explained in this section. See Section 8.7 for operation of<br />
the Visible Speech screen.<br />
8.4.1 Measuring in the Insertion Gain screen<br />
Insertion Gain is the most conventional method used for performing real-ear<br />
measurements. In the typical insertion gain procedure:<br />
1. The probe tube is inserted into the ear canal. (Section 8.2.3)<br />
2. The sound field speaker is leveled. (Section 8.2.4)<br />
3. The unaided response is measured. (Section 8.4.3)<br />
4. The hearing aid is carefully inserted into the ear.<br />
5. The aided response is measured. (Section 8.4.4)<br />
6. The insertion gain response is compared to the prescribed insertion gain target<br />
and any necessary adjustments are made to the hearing aid in order for<br />
the response to better match the target.<br />
The Insertion Gain screen itself consists of two graphs. (See Figure 8.4.1.) The<br />
bottom graph displays an unaided response and up to four aided responses in<br />
dB Gain or dB SPL. The top graph displays a prescribed insertion gain target<br />
and up to four insertion gain curves. Insertion gain is the difference between the<br />
patient’s aided and the unaided responses.


