FY 2012 Operating Budget and FY 2013-2017 Financial ... - Septa
FY 2012 Operating Budget and FY 2013-2017 Financial ... - Septa
FY 2012 Operating Budget and FY 2013-2017 Financial ... - Septa

You also want an ePaper? Increase the reach of your titles
YUMPU automatically turns print PDFs into web optimized ePapers that Google loves.
<strong>Operating</strong> Goals <strong>and</strong> Performance Evaluation Measures<br />
SAFETY GOALS<br />
Safety related goals are developed <strong>and</strong> monitored by the Public <strong>and</strong> Operational Safety<br />
Division. The safety goals for Fiscal <strong>2012</strong> were developed with targeted improvement. For<br />
comparison purposes in this document, SEPTA utilizes 12 months of actual data from Fiscal<br />
Year 2010 <strong>and</strong> <strong>Budget</strong>ed Goals for Fiscal Year 2011 as the benchmark period for the reporting<br />
of safety goals.<br />
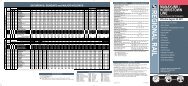
Passenger Accidents Per 100,000 Miles<br />
Fiscal Fiscal Fiscal<br />
Year 2010 Year 2011 Year <strong>2012</strong><br />
Actual Actual Goal<br />
Surface Transportation<br />
CTD Bus 2.70 5.12 4.96<br />
CTD Trackless Trolley 2.43 4.95 4.81<br />
Victory Bus 3.49 4.22 4.10<br />
Frontier Bus 1.18 1.06 1.03<br />
Regional Rail 0.23 0.08 0.08<br />
Subway / Light Rail<br />
Broad Street Line 0.85 0.91 0.88<br />
Market-Frankford Line 0.49 1.22 1.18<br />
Norristown High Speed Line 0.11 0.00 0.00<br />
Callowhill Light Rail 11.24 3.28 3.38<br />
Elmwood Light Rail 2.00 2.81 2.89<br />
Media/Sharon Hil Line 4.34 4.26 4.13<br />
SEPTA Fiscal Year <strong>2012</strong> <strong>Operating</strong> <strong>Budget</strong> 146