FY 2012 Operating Budget and FY 2013-2017 Financial ... - Septa
FY 2012 Operating Budget and FY 2013-2017 Financial ... - Septa
FY 2012 Operating Budget and FY 2013-2017 Financial ... - Septa

You also want an ePaper? Increase the reach of your titles
YUMPU automatically turns print PDFs into web optimized ePapers that Google loves.
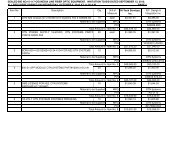
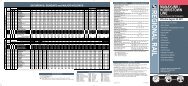
<strong>Operating</strong> Goals <strong>and</strong> Performance Evaluation Measures<br />
Vehicular Accidents Per 100,000 Miles<br />
Fiscal Fiscal Fiscal<br />
Year 2010 Year 2011 Year <strong>2012</strong><br />
Actual Actual Goal<br />
Surface Transportation<br />
CTD Bus 7.87 8.81 6.56<br />
CTD Trackless Trolley 7.18 7.69 7.98<br />
Victory Bus 3.93 4.31 3.11<br />
Frontier Bus 1.15 1.32 1.18<br />
Regional Rail 0.42 0.15 0.36<br />
Subway / Light Rail<br />
Broad Street Line 0.05 0.04 0.01<br />
Market-Frankford Line 0.01 0.04 0.01<br />
Norristown High Speed Line 0.00 0.00 0.13<br />
Callowhill Light Rail 24.62 11.39 14.25<br />
Elmwood Light Rail 6.04 5.59 5.63<br />
Media/Sharon Hil Line 6.25 7.45 6.73<br />
Station Accidents Per 1,000,000 Passengers<br />
Fiscal Fiscal Fiscal<br />
Year 2010 Year 2011 Year <strong>2012</strong><br />
Actual Actual Goal<br />
Regional Rail 2..25 0.76 0.74<br />
Subway / Light Rail<br />
Broad Street Line 0.44 0.67 0.65<br />
Market-Frankford Line 0.97 1.37 1.32<br />
Norristown High Speed Line 0.00 0.00 0.00<br />
SEPTA Fiscal Year <strong>2012</strong> <strong>Operating</strong> <strong>Budget</strong> 147