FY 2012 Operating Budget and FY 2013-2017 Financial ... - Septa
FY 2012 Operating Budget and FY 2013-2017 Financial ... - Septa
FY 2012 Operating Budget and FY 2013-2017 Financial ... - Septa

Create successful ePaper yourself
Turn your PDF publications into a flip-book with our unique Google optimized e-Paper software.
<strong>Operating</strong> Goals <strong>and</strong> Performance Evaluation Measures<br />
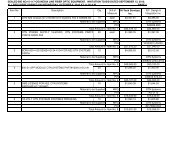
Mean Distance Between Failure (MDBF)<br />
This is a measure of reliability often used in both rail <strong>and</strong> roadway transportation. The<br />
measure expresses the average distance (in miles) travelled by a bus or a rail vehicle before<br />
preventive maintenance or repairs are required. A table illustrating the Mean Distance<br />
Between Failure rates <strong>and</strong> Fiscal Year <strong>2012</strong> goals for all SEPTA transportation modes<br />
follows:<br />
Mean Distance Between Failure<br />
Fiscal Fiscal Fiscal<br />
Year 2010 Year 2011 Year <strong>2012</strong><br />
Actual Actual Goal<br />
Surface Transportation<br />
Bus City/Suburban 7,066 8,753 10,625<br />
Rail Transportation<br />
Trolley (Subway-Surface &Route 15) 5,963 5,431 7,000<br />
Media-Sharon Hill Line 15,892 22,372 25,000<br />
Norristown High Speed Line 32,211 34,099 35,000<br />
Broad Street Line 123,883 150,370 160,000<br />
Market-Frankford Line 71,107 76,373 85,000<br />
Regional Rail 42,828 38,965 50,000<br />
SEPTA Fiscal Year <strong>2012</strong> <strong>Operating</strong> <strong>Budget</strong> 154