Download (28Mb) - LSE Theses Online
Download (28Mb) - LSE Theses Online
Download (28Mb) - LSE Theses Online

You also want an ePaper? Increase the reach of your titles
YUMPU automatically turns print PDFs into web optimized ePapers that Google loves.
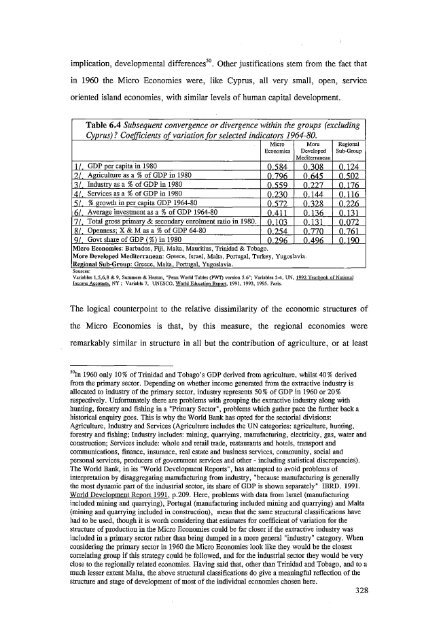
implication, developmental différences 50 . Other justifications stem from the fact that<br />
in 1960 the Micro Economies were, like Cyprus, ail very small, open, service<br />
oriented island économies, with similar levels of human capital development.<br />
Table 6.4 Subséquent convergence or divergence within the groups (excluding<br />
Cyprus)? Coefficients of variation for selected indicators 1964-80.<br />
Micro<br />
Economies<br />
More<br />
Developed<br />
Mediterranean<br />
Regional<br />
Sub-Group<br />
1/. GDP per capita in 1980 0.584 0.308 0.124<br />
2/. Agriculture as a % of GDP in 1980 0.796 0.645 0.502<br />
3/. Industry as a % of GDP in 1980 0.559 0.227 0.176<br />
4/. Services as a % of GDP in 1980 0.230 0.144 0.116<br />
5/. % growth in per capita GDP 1964-80 0.572 0.328 0.226<br />
6/. Average investment as a % of GDP 1964-80 0.411 0.136 0.131<br />
7/. Total gross primary & secondary enrolment ratio in 1980. 0.103 0.131 0.072<br />
8/. Openness; X & M as a % of GDP 64-80 0.254 0.770 0.761<br />
9/. Govt share of GDP (%) in 1980 0.296 0.496 0.190<br />
Micro Economies: Barbados, Fiji, Malta, Mauritius, Trinidad & Tobago.<br />
More Developed Mediterranean: Greece, Israel, Malta, Portugal, Turkey, Yugoslavia.<br />
Regional Sub-Group: Greece, Malta, Portugal, Yugoslavia.<br />
Sources:<br />
Variables 1,5,6,8 & 9, Summers & Heston, "Penn World Tables (PWT) version 5.6"; Variables 2-4, UN, 1992 Yearbook of National<br />
Income Accounts, NY ; Variable 7, UNESCO, World Education Report. 1991, 1993, 1995. Paris.<br />
The logical counterpoint to the relative dissimilarity of the economic structures of<br />
the Micro Economies is that, by this measure, the regional économies were<br />
remarkably similar in structure in ail but the contribution of agriculture, or at least<br />
50 In 1960 only 10% of Trinidad and Tobago's GDP derived from agriculture, whilst 40% derived<br />
from the primary sector. Depending on whether income generated from the extractive industry is<br />
allocated to industry of the primary sector, industry represents 50% of GDP in 1960 or 20%<br />
respectively. Unfortunately there are problems with grouping the extractive industry along with<br />
hunting, forestry and fishing in a "Primary Sector", problems wliich gather pace the further back a<br />
historical enquiry goes. This is why the World Bank has opted for the sectorial divisions:<br />
Agriculture, Industry and Services (Agriculture includes the UN catégories: agriculture, hunting,<br />
forestry and fishing; Industry includes: mining, quarrying, manufacturing, electricity, gas, water and<br />
construction; Services include: whole and retail trade, restaurants and hôtels, transport and<br />
communications, finance, insurance, real estate and business services, community, social and<br />
Personal services, producers of government services and other - including statistical discrepancies).<br />
The World Bank, in its "World Development Reports", has attempted to avoid problems of<br />
interprétation by disaggregating manufacturing from industry, "because manufacturing is generally<br />
the most dynamic part of the industrial sector, its share of GDP is shown separately" IBRD. 1991.<br />
World Development Report 1991. p.209. Here, problems with data from Israël (manufacturing<br />
included mining and quarrying), Portugal (manufacturing included mining and quarrying) and Malta<br />
(mining and quarrying included in construction), mean that the same structural classifications have<br />
had to be used, though it is worth considering that estimâtes for coefficient of variation for the<br />
structure of production in the Micro Economies could be far closer if the extractive industry was<br />
included in a primary sector rather than being dumped in a more général "industry" category. When<br />
considering the primary sector in 1960 the Micro Economies look like they would be the closest<br />
correlating group if this strategy could be followed, and for the industrial sector they would be very<br />
close to the regionally related économies. Having said that, other than Trinidad and Tobago, and to a<br />
much lesser extent Malta, the above structural classifications do give a meaningful reflection of the<br />
structure and stage of development of most of the individual économies chosen here.<br />
328