- Page 1 and 2:
ACKNOWLEDGEMENTS I would like to th
- Page 3 and 4:
ABSTRACT This thesis examines the e
- Page 5 and 6:
Table Of Contents Page Change in ec
- Page 7 and 8:
List Of Figures 2.27 Revenue from t
- Page 9 and 10:
List Of Figures 5.25 Main destinati
- Page 11 and 12:
List Of Figures 7.8 The degree of o
- Page 13 and 14:
List Of Tables 6.7 All island, Gree
- Page 15 and 16:
This thesis will examine the econom
- Page 17 and 18:
Vassiliou's classic work 5 publishe
- Page 19 and 20:
As many questions raised by economi
- Page 21 and 22:
Figure 1.1 The structure of recent
- Page 23 and 24:
In terms of the topic of this thesi
- Page 25 and 26:
political landmark coincides with a
- Page 27 and 28:
were the mechanisms which encourage
- Page 29 and 30:
however, Chapter 5 concentrates on
- Page 31 and 32:
Defining the title The first priori
- Page 33 and 34:
such? Is northern Cyprus simply run
- Page 35 and 36:
unlike Greece in 1923, were already
- Page 37 and 38:
itself as having been literally und
- Page 39 and 40:
economic history, Christodoulou's s
- Page 41 and 42:
incurred as a resuit of eonfl ict.
- Page 43 and 44:
Christodoulou has concentrated his
- Page 45 and 46:
any credit for successful economic
- Page 47 and 48:
anking technology, administrative c
- Page 49 and 50:
(which usually has a regressive imp
- Page 51 and 52:
contribution did labour remittances
- Page 53 and 54:
having been inspired by Zetter's in
- Page 55 and 56:
econstruction also provided a means
- Page 57 and 58:
Conclusion In analysing the extent
- Page 59 and 60:
he drew distinct analogies with the
- Page 61 and 62:
in Cyprus. The main objective is a
- Page 63 and 64:
The war proved a watershed in many
- Page 65 and 66:
Uruguay, Japan, Trinidad and Tobago
- Page 67 and 68:
financial, property and business se
- Page 69 and 70:
By 1960 exports represented over 20
- Page 71 and 72:
Table 2.1 Domestic Exports FOB in 1
- Page 73 and 74:
the period (1960-73), the différen
- Page 75 and 76:
Figure 2.4 Principal exports as a p
- Page 77 and 78:
producing 12% of GDP. Tourism (rest
- Page 79 and 80:
considerably more than Turkey, whos
- Page 81 and 82:
income. Mining and quarrying (now m
- Page 83 and 84:
Figure 2.10 Principal exports as a
- Page 85 and 86:
Figure 2.12 The Destination of the
- Page 87 and 88:
Figure 2.14 Ambiguous indicators: T
- Page 89 and 90:
Figure 2.15 Sìze of manufacturing
- Page 91 and 92:
By 1980 the economy of the Republic
- Page 93 and 94:
The scale of the disruption in the
- Page 95 and 96:
Whether taking the optimists approa
- Page 97 and 98:
financing from financial markets pi
- Page 99 and 100:
grew rapidly. In the immediate afte
- Page 101 and 102:
One of the major problems facing th
- Page 103 and 104:
coming, only concerning policy make
- Page 105 and 106:
with particular bottlenecks affecti
- Page 107 and 108:
"We attributed this finding to the
- Page 109 and 110:
aiding the recovery from the coup a
- Page 111 and 112:
employment: rapidly rising real ear
- Page 113 and 114:
Until the intervention of public fi
- Page 115 and 116:
to pick the Republic of Cyprus as t
- Page 117 and 118:
of offshore companies registered in
- Page 119 and 120:
Figure 2.27 Revenue from the offsho
- Page 121 and 122:
Figure 2.29 The changing compositio
- Page 123 and 124:
The structure of the economy, the c
- Page 125 and 126:
CHAPTER 3. The foundations of Takis
- Page 127 and 128:
Famagusta enclaves would be over-ru
- Page 129 and 130:
The historical context of separate
- Page 131 and 132:
generally concentrated in the lower
- Page 133 and 134:
agreed Constitution. Seemingly Clar
- Page 135 and 136:
séparation of the communities bega
- Page 137 and 138:
UN. 37 Some additional supplies mus
- Page 139 and 140:
Seemingly, by 1970 the Nicosia encl
- Page 141 and 142:
was made on the basis of a fixed in
- Page 143 and 144:
derived from Turkish transfer payme
- Page 145 and 146:
Patrick has offered a more complica
- Page 147 and 148:
spare parts and maintenance materia
- Page 149 and 150:
Emphasising the growing divisions b
- Page 151 and 152:
Chamber, Rauf Denktash, said people
- Page 153 and 154:
Figure 3.2 Thepossible economic eff
- Page 155 and 156:
produced by them rises significantl
- Page 157 and 158:
Committee" was the area military co
- Page 159 and 160:
February 1975 the latter bodies set
- Page 161 and 162:
The first five-year pian, published
- Page 163 and 164:
CHAPTER 4. The construction of a Tu
- Page 165 and 166:
Whilst the Turkish-Cypriot leadersh
- Page 167 and 168:
of supply, and/or marketing, in key
- Page 169 and 170:
shipment of 2000 tons of foodstuffs
- Page 171 and 172:
Eti still operateci out of Nicosia,
- Page 173 and 174:
institutions in northern Cyprus amo
- Page 175 and 176:
with multipurpose co-operatives, a
- Page 177 and 178:
A few new co-operatives were formed
- Page 179 and 180:
loans. Savings Banks do have access
- Page 181 and 182:
espectively. The Famagusta branch w
- Page 183 and 184:
Cypriot) Government in the 1960s, t
- Page 185 and 186:
increasing costs 31 . This is perha
- Page 187 and 188:
packages imported raffinate, supply
- Page 189 and 190:
a monopoly respectively. Where ther
- Page 191 and 192:
Evkaf is an Islamic organisation fo
- Page 193 and 194:
Evkaf had a largely obscure economi
- Page 195 and 196:
Meanwhile a little noticed phenomen
- Page 197 and 198:
After the summer of 1974, the Turki
- Page 199 and 200:
monitored Ledra Place check-point,
- Page 201 and 202:
the early eighties, when Turkish ar
- Page 203 and 204:
Figure 4.3 Number of tourists from
- Page 205 and 206:
the situation that had existed prio
- Page 207 and 208:
stay arrivais or diminish with the
- Page 209 and 210:
competing with the longer establish
- Page 211 and 212:
flexibility of family business stru
- Page 213 and 214:
Ltd., Turkish-Cypriots eventually g
- Page 215 and 216:
dominateci by: textiles, footwear a
- Page 217 and 218:
force of national cohésion, change
- Page 219 and 220:
Figure 4.9 Main Citrus Exporters in
- Page 221 and 222:
Ismail Bozkurt (who secured 32.1% o
- Page 223 and 224:
Table 4.9 Citrus exports from north
- Page 225 and 226:
Ultimately the failure to act on pr
- Page 227 and 228:
CHAFTER 5: Re-establishing economic
- Page 229 and 230:
prospects of their respective de fa
- Page 231 and 232:
Figure 5.1 Change in Cypriot GDP as
- Page 233 and 234:
{0 perceive the de facto situation
- Page 235 and 236:
Turkey maintains that her objective
- Page 237 and 238:
parliament during the unstable peri
- Page 239 and 240:
case study, he argues that given en
- Page 241 and 242:
Specifically, it is analysis of nat
- Page 243 and 244:
imports (Figure 5.5). The extent to
- Page 245 and 246:
(which includes the increasingly im
- Page 247 and 248:
If "a leading sector in the process
- Page 249 and 250:
Just to put minds at rest that manu
- Page 251 and 252:
encouraged private sector action, t
- Page 253 and 254:
Figure 5.13 Gross domestic fixed ca
- Page 255 and 256:
major economic force, one that was
- Page 257 and 258:
they account for around a third of
- Page 259 and 260:
dominates international transfer pa
- Page 261 and 262:
a "development resource" 54 , rathe
- Page 263 and 264:
able to spearhead a revival aided,
- Page 265 and 266:
path, policy objectives moved to co
- Page 267 and 268:
overwhelming dependence on a genera
- Page 269 and 270:
In the difficult times that followe
- Page 271 and 272:
independence from total Turkish fin
- Page 273 and 274:
Figure 5.20 Orange production as a
- Page 275 and 276:
e exchanged for new "TRNC" (or, as
- Page 277 and 278:
Unlike the vineyards where most of
- Page 279 and 280: Although not important in the initi
- Page 281 and 282: Having said this, constant improvem
- Page 283 and 284: compensation arrangements in the no
- Page 285 and 286: some of the labour intensive stages
- Page 287 and 288: Figure 5.24 Proportion of citrus ex
- Page 289 and 290: to treat exports from the whole of
- Page 291 and 292: seem more politically motivateci an
- Page 293 and 294: Figure 6.1 Percentage change in GNP
- Page 295 and 296: initially. The more immediate probl
- Page 297 and 298: historical phenomena (large externa
- Page 299 and 300: It has been argued that if politics
- Page 301 and 302: share of National Income to somethi
- Page 303 and 304: Figure 6.6 Communal income in 1980,
- Page 305 and 306: Selecting peers as proxies for pan-
- Page 307 and 308: growth potential to Cyprus in 1960,
- Page 309 and 310: was that compatible data should be
- Page 311 and 312: Figure 6.9 Micro Economies; average
- Page 313 and 314: Figure 6.11 Micro Economies; averag
- Page 315 and 316: Figure 6.13 The level of government
- Page 317 and 318: Figure 6.14 "More Developed Medìte
- Page 319 and 320: Figure 6.17 "More DevelopedMediterr
- Page 321 and 322: Cypriot growth rate, should not dis
- Page 323 and 324: Figure 6.22 Structure of production
- Page 325 and 326: Figure 6.26 Degree of openness in t
- Page 327 and 328: economic growth 49 (variables 6-9:
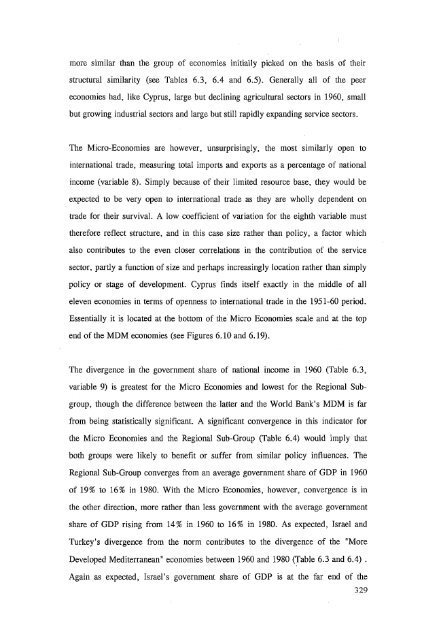
- Page 329: implication, developmental différe
- Page 333 and 334: namely investment rates 54 (in phys
- Page 335 and 336: instruments, the justification for
- Page 337 and 338: Figure 6.28 Average annual growth i
- Page 339 and 340: Figure 6.29 How Cyprusfared in 1980
- Page 341 and 342: Figure 6.30 Total Cypriot income 19
- Page 343 and 344: o.zö; may reveai someimng 01 ine e
- Page 345 and 346: developments elsewhere. The relativ
- Page 347 and 348: unified economy) of 1963, Cyprus is
- Page 349 and 350: CHAPTER 7. Conclusion 348 Comparati
- Page 351 and 352: Turkish-Cypriot economy stagnateci.
- Page 353 and 354: So it is worth looking again at the
- Page 355 and 356: stand out however, revealing enough
- Page 357 and 358: Figure 7.3 Gross domestic investmen
- Page 359 and 360: Figure 7.5 "TRNC netforeign trade a
- Page 361 and 362: Figure 7.8 The degree of openness i
- Page 363 and 364: control. There seems to be ampie ex
- Page 365 and 366: The role of tourism in the economic
- Page 367 and 368: seem to be able to grow in line wit
- Page 369 and 370: Comparisons throughout this thesis
- Page 371 and 372: The Cyprus Mail Hellenic Group. Nic
- Page 373 and 374: I.M.F. International Financial Stat
- Page 375 and 376: 1982. Fourth Emergency Economic Act
- Page 377 and 378: "Turkish Federated State of Kibris"
- Page 379 and 380: leadership of the two communities o
- Page 381 and 382:
"administrations" and key economic
- Page 383 and 384:
Bicak, H.A. (June) 1990. "The Impac
- Page 385 and 386:
Hudson, J. and Dyniotou-Jensen M. 1
- Page 387 and 388:
Mcdonald, R. 1989. The Problem of C
- Page 389 and 390:
Solsten, E. (ed.) 1993. Cvprus: A c


