- Page 1:
ChemOffice.Com ® ChemOffice ® Ent
- Page 4 and 5:
License Information ChemOffice, Che
- Page 6 and 7:
· Licensed users of ChemOffice Ent
- Page 8 and 9:
computer, except as provided below.
- Page 10 and 11:
Q: IS IT OK TO COPY MY COLLEAGUE’
- Page 12 and 13:
A Guide to CambridgeSoft Manuals An
- Page 14 and 15:
Administrator Viewing Marked Record
- Page 16 and 17:
Administrator Formgroup . . . . . .
- Page 18 and 19:
Administrator Logging Off . . . . .
- Page 20 and 21:
Administrator viii•Contents Cambr
- Page 22 and 23:
Administrator x•ChemOffice Enterp
- Page 24 and 25:
Administrator 2• CambridgeSoft
- Page 26 and 27:
Administrator Submitting Documents
- Page 28 and 29:
Performing a Search The Search Resu
- Page 30 and 31:
Administrator 8• CambridgeSoft
- Page 32 and 33:
The Registration System log in page
- Page 34 and 35:
Administrator The Batch Registratio
- Page 36 and 37:
Administrator change the format of
- Page 38 and 39:
Administrator To add analytics data
- Page 40 and 41:
Administrator 2. Take the appropria
- Page 42 and 43:
Administrator 2. Take the appropria
- Page 44 and 45:
If you want to Then To add a new so
- Page 46 and 47:
Administrator Defining Result Type
- Page 48 and 49:
Administrator When an .sdf file is
- Page 50 and 51:
If you want to Then Administrator I
- Page 52 and 53:
Administrator Viewing System Duplic
- Page 54 and 55:
Administrator 32•Registration Sys
- Page 56 and 57:
Adding a Product/Substance Adding a
- Page 58 and 59:
Administrator To view details of a
- Page 60 and 61:
Administrator To edit a lab in the
- Page 62 and 63:
To edit a status in the Status tabl
- Page 64 and 65:
To edit a experiment type in the Ex
- Page 66 and 67:
Administrator 44•Formulations & M
- Page 68 and 69:
Administrator Location An Inventory
- Page 70 and 71:
Administrator • Comments The rema
- Page 72 and 73:
Administrator There are two options
- Page 74 and 75:
Administrator simplest way to refle
- Page 76 and 77:
Administrator The New Substance for
- Page 78 and 79:
Administrator Enterprise The option
- Page 80 and 81:
Administrator 3. Click the Manage S
- Page 82 and 83:
Administrator open abbreviated edit
- Page 84 and 85:
Administrator The following window
- Page 86 and 87:
Administrator 4. When you have ente
- Page 88 and 89:
Administrator Creating Daughter Pla
- Page 90 and 91:
Administrator 4. Make the appropria
- Page 92 and 93:
Administrator container (left frame
- Page 94 and 95:
Administrator A list of containers
- Page 96 and 97:
Administrator Amount, Supplier Name
- Page 98 and 99:
Administrator • Click the linked
- Page 100 and 101:
Administrator Reports Inventory Ult
- Page 102 and 103: Administrator 3. Select the table t
- Page 104 and 105: Administrator Enterprise Analyze Au
- Page 106 and 107: Administrator 84•Inventory Cambri
- Page 108 and 109: Administrator Browsing Search resul
- Page 110 and 111: Administrator Your report appears.
- Page 112 and 113: Administrator The New Action form a
- Page 114 and 115: Administrator Actions and Test are
- Page 116 and 117: Administrator The input values for
- Page 118 and 119: Administrator To retire a User 1. C
- Page 120 and 121: Administrator 98• CambridgeSoft
- Page 122 and 123: • Direct Connection - BioAssay cl
- Page 124 and 125: Administrator To resize the columns
- Page 126 and 127: Administrator Fields contained in t
- Page 128 and 129: Administrator 3. Click Add. 6. Drag
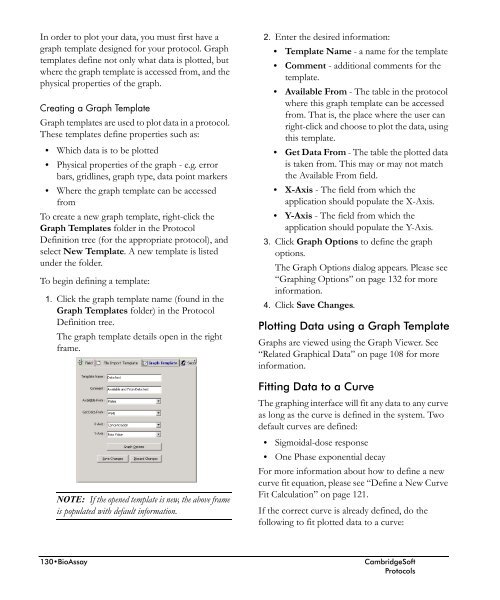
- Page 130 and 131: may contain 2 tables, a plates and
- Page 132 and 133: Administrator table in the above im
- Page 134 and 135: 4. Select the template you would li
- Page 136 and 137: If you would like to... Then... c.
- Page 138 and 139: Administrator • Fields which will
- Page 140 and 141: Administrator 7. Select the number
- Page 142 and 143: 7. Continue with step 4 in Use a De
- Page 144 and 145: Administrator 3. Enter a name for t
- Page 146 and 147: a. Click Add to add parameters for
- Page 148 and 149: 7. Select the type of file you are
- Page 150 and 151: Data Source File Type Description T
- Page 154 and 155: Administrator Equation The Equation
- Page 156 and 157: Administrator Click OK. Graph Optio
- Page 158 and 159: Administrator To define the general
- Page 160 and 161: Administrator BioAssay uses the Che
- Page 162 and 163: Administrator 140•BioAssay Cambri
- Page 164 and 165: Administrator Login to BioSAR Enter
- Page 166 and 167: Administrator Edit Schema Descripti
- Page 168 and 169: Administrator have one primary key,
- Page 170 and 171: To specify a parent column for a fi
- Page 172 and 173: Administrator Selecting Fields in a
- Page 174 and 175: Administrator Display Order of Fiel
- Page 176 and 177: The following warning appears: The
- Page 178 and 179: Administrator To access a query in
- Page 180 and 181: Administrator To generate a report:
- Page 182 and 183: Administrator 2. Enter the appropri
- Page 184 and 185: If you would like to ... Then ... T
- Page 186 and 187: Administrator 164•BioSAR Enterpri
- Page 188 and 189: Administrator 166• CambridgeSoft
- Page 190 and 191: Administrator To make changes to th
- Page 192 and 193: Feature Description Feature Descrip
- Page 194 and 195: Search Field Action The Results Lis
- Page 196 and 197: Administrator of search is indicate
- Page 198 and 199: Administrator The ChemOffice WebSer
- Page 200 and 201: Administrator hits retrieved for yo
- Page 202 and 203:
Administrator 3. Select the Make Pu
- Page 204 and 205:
Administrator Restore Option Subtra
- Page 206 and 207:
Administrator Setting Your Display
- Page 208 and 209:
Administrator Logging Off When you
- Page 210 and 211:
Administrator During the installati
- Page 212 and 213:
Administrator It is important to re
- Page 214 and 215:
Administrator where each parameter
- Page 216 and 217:
Administrator Those conversion func
- Page 218 and 219:
Administrator • FMFldName • CNT
- Page 220 and 221:
Administrator the actual version of
- Page 222 and 223:
Administrator ) ) SID_LIST_LISTENER
- Page 224 and 225:
Administrator literals n = Len(s) '
- Page 226 and 227:
Administrator Set r = c.Execute("SE
- Page 228 and 229:
Administrator 1 row created. ID M -
- Page 230 and 231:
Administrator Chem3D—A molecular
- Page 232 and 233:
Administrator Using The Merck Index
- Page 234 and 235:
Administrator The Search Tab allows
- Page 236 and 237:
Using Ashgate Drugs Online Click on
- Page 238 and 239:
Administrator 216•Ashgate Drugs C
- Page 240 and 241:
Administrator Opening ChemACX To op
- Page 242 and 243:
Administrator To view a record's en
- Page 244 and 245:
Administrator Note: To compare more
- Page 246 and 247:
Administrator To export shopping ca
- Page 248 and 249:
Administrator Saving Hitlists and E
- Page 250 and 251:
Administrator 228•ChemACX Cambrid
- Page 252 and 253:
Administrator Using ChemSCX on CD T
- Page 254 and 255:
Administrator 232•ChemSCX Cambrid
- Page 256 and 257:
Administrator 234•ChemMSDX Cambri
- Page 258 and 259:
Administrator GO button at the uppe
- Page 260 and 261:
Administrator The reactions in Chem
- Page 262 and 263:
Administrator 240•ChemRXN Cambrid
- Page 264 and 265:
Administrator 3. AIDS Antiviral Scr
- Page 266 and 267:
Administrator 244•AIDS CambridgeS
- Page 268 and 269:
Administrator 246• CambridgeSoft
- Page 270 and 271:
Function Name Description Administr
- Page 272 and 273:
Administrator For example, the foll
- Page 274 and 275:
For example, the following searches
- Page 276 and 277:
Administrator The NEAR operator can
- Page 278 and 279:
For example, the following searches
- Page 280 and 281:
AutoFit On The Change Validity wind
- Page 282 and 283:
Administrator 260•BioAssay Action
- Page 284 and 285:
Administrator 262•BioAssay Plate
- Page 286 and 287:
Administrator 264•Oracle Cartridg
- Page 288 and 289:
Cayman Chemical Company Celanese, L
- Page 290 and 291:
Marker Gene Technologies, Inc. Mars
- Page 292 and 293:
Varsal Instruments, Inc. VIS Farmac
- Page 294 and 295:
Administrator 272•ChemSCX Partici
- Page 296 and 297:
Administrator 274•ChemSCX Partici
- Page 298 and 299:
There are several ways to make anot
- Page 300 and 301:
Administrator By default, the field
- Page 302 and 303:
Administrator Searching by name For
- Page 304 and 305:
4. point 5. click 11.Double-click t
- Page 306 and 307:
Administrator Performing a Combined
- Page 308 and 309:
Administrator Clearing marked recor
- Page 310 and 311:
Administrator Requirements, install
- Page 312 and 313:
Administrator vi•Index CambridgeS
- Page 314 and 315:
CAMBRIDGESOFT ChemOffice Desktop to
- Page 316 and 317:
CS ChemOffice Software Suites ChemO
- Page 318 and 319:
DESKTOP CS E-Notebook Electronic Jo
- Page 320 and 321:
DESKTOP CS ChemDraw Chemical Struct
- Page 322 and 323:
DESKTOP CS Chem3D Molecular Modelin
- Page 324 and 325:
DESKTOP CS ChemFinder Searching and
- Page 326 and 327:
DESKTOP CS ChemInfo Reference and C
- Page 328 and 329:
ENTERPRISE ChemOffice WebServer Ent
- Page 330 and 331:
ENTERPRISE Oracle Cartridge Enterpr
- Page 332 and 333:
KNOWLEDGE E-Notebook Enterprise Des
- Page 334 and 335:
KNOWLEDGE Document Manager Desktop
- Page 336 and 337:
KNOWLEDGE 21CFR11 Compliance Electr
- Page 338 and 339:
RESEARCH & Registration System Chem
- Page 340 and 341:
RESEARCH & Inventory Manager Chemic
- Page 342 and 343:
RESEARCH & CombiChem Enterprise Des
- Page 344 and 345:
RESEARCH & BioAssay HTS Biological
- Page 346 and 347:
RESEARCH & BioSAR Browser Biologica
- Page 348 and 349:
CHEMICAL ChemACX Database Available
- Page 350 and 351:
CHEMICAL The Merck Index Chemistry
- Page 352 and 353:
CHEMICAL Chemical Databases Referen
- Page 354 and 355:
CONSULTING & Consulting & Services
- Page 357:
CS Software Problem Report For fast