TWENTY-SIXTH ANNUAL REPORT - National Labor Relations Board
TWENTY-SIXTH ANNUAL REPORT - National Labor Relations Board
TWENTY-SIXTH ANNUAL REPORT - National Labor Relations Board

You also want an ePaper? Increase the reach of your titles
YUMPU automatically turns print PDFs into web optimized ePapers that Google loves.
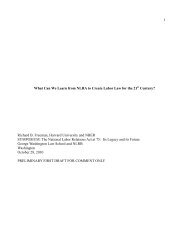
Table 5.—Industrial Distribution of Unfair <strong>Labor</strong> Practice and Representation Cases Received,<br />
Fiscal Year 1961<br />
h.1<br />
Industrial group'<br />
All<br />
cases<br />
All C<br />
cases<br />
unfair labor practice cases<br />
CA' CB S CC' CD' CE' CP 1 All R<br />
CMOS<br />
Representation cases<br />
RC' RM 1 RD'<br />
- - -<br />
Total 72,640 12,132 8,136 2,520 815 288 a 316 10,508 9,177 738 593<br />
Manufacturing .0 11, 469 5,676 4,342 889 142 90 1 94 5,793 5,091 340 362<br />
Ordnance and accessories 20 9 a 4 0 o 0 11 9 1 1<br />
Food and kindred products 1,824 860 651 117 54 13 17 964 858 63 43<br />
Tobacco manufacturers 24 18 12 4 1 1 0 6 5 0 1<br />
Textile mill products 264 145 116 23 1 0 5 119 100 8 11<br />
Apparel and other finished products made from fabric and similar<br />
materials 423 298 199 57 18 3 19 125 100 14 11<br />
Lumber and wood products (except furniture) 480 179 149 19 5 0 6 301 247 37 17<br />
Furniture and fixtures 460 248 214 29 3 0 2 212 186 14 12<br />
Paper and allied products 402 155 118 27 7 2 1 247 233 4 10<br />
Printing, publishing, and allied industries. 669 296 211 44 19 11 7 373 334 17 22<br />
Chemicals and allied products 658 267 205 36 13 7 6 391 348 21 22<br />
Products of petroleum and coal 174 81 60 14 7 0 0 93 70 6 17<br />
Rubber products 403 188 160 23 4 0 1 215 189 7 19<br />
Leather and leather products 182 107 89 14 1 0 3 75 68 4 3<br />
Stone, clay and glass products 621 297 227 44 14 8 4 324 298 15 11<br />
Primary metal industries 670 328 258 58 6 5 1 342 308 15 19<br />
Fabricated metal products (except machinery and transportation<br />
equipment) 1,167 576 476 70 10 13 6 591 522 33 36<br />
Machinery (except electrical) 862 3E0 315 50 14 1 0 482 413 28 41<br />
Electrical machinery, equipment, and supplies 844 451 337 87 19 3 4 393 330 24 39<br />
Aircraft and parts 220 152 107 30 14 0 o 68 51 10 7<br />
Ship and boat building and repairing 154 107 68 30 5 2 2 47 45 1 1<br />
Automotive and other transportation equipment 388 223 159 33 14 12 5 165 147 8 10<br />
Professional, scientific, and controlling instruments 129 64 49 7 4 4 0 65 63 2 0<br />
Miscellaneous manufacturing 431 247 157 69 9 5 5 184 167 8 9<br />
------..<br />
kgriculture, forestry, and fisheries 15 5 5 0 0 0 0 10 10 o o<br />
Wining 226 140 99 27 5 5 a as 76 6 4<br />
Metal mining<br />
Coal mining<br />
Crude petroleum and natural gas production<br />
Nonmetallic mining and quarrying<br />
62<br />
93<br />
13<br />
68<br />
19<br />
75<br />
6<br />
40<br />
16<br />
46<br />
1<br />
36<br />
3<br />
20<br />
2<br />
2<br />
0 0 0 33 32 0 1<br />
3 3 a 18 14 4 o<br />
1 2<br />
7 6 1 0<br />
1 0<br />
0 28 24 1 3