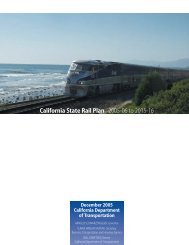
<strong>2007</strong>-<strong>08</strong> – <strong>2017</strong>-<strong>18</strong> <strong>California</strong> <strong>State</strong> <strong>Rail</strong> <strong>Plan</strong>Figure 6CRidership DataPACIFIC SURFLINER RouteAnnual Operating Performance - <strong>State</strong> Fiscal YearsFinancial Data for Operations - <strong>State</strong> Supported Train and Bus Service Only*<strong>State</strong><strong>State</strong>Fiscal All Trains Supported* Train Loss FareboxYear Ridership PM/TM Ridership Revenue Expense Loss <strong>State</strong> Cost Amtrak Cost per PM RatioNotes (F1) (F2) (F3) (F4) (F5) (F6)1973-74 (S1) 381,8441974-75 356,6301975-76 376,9001976-77 (S2) 607,976 146 101,572 $ 598,140 $ 1,662,714 $ 1,064,574 $ 548,53436.0%1977-78 (S3) 753,246 128 258,800 $ 1,446,036 $ 3,768,065 $ 2,322,029 $ 1,325,<strong>08</strong>738.4%1978-79 967,316 163 415,865 $ 2,203,403 $ 4,333,602 $ 2,130,199 $ 1,178,66750.8%1979-80 1,2<strong>18</strong>,196 177 557,113 $ 3,341,561 $ 5,536,840 $ 2,195,279 $ 1,064,71360.4%1980-81 (S4) 1,238,135 152 555,4<strong>18</strong> $ 4,032,480 $ 6,572,539 $ 2,540,059 $ 1,233,49061.4%1981-82 1,167,7<strong>18</strong> 144 533,093 $ 4,097,254 $ 6,607,395 $ 2,510,141 $ 1,217,4<strong>18</strong>6.3¢ 62.0%1982-83 1,131,146 138 488,606 $ 4,094,750 $ 6,928,334 $ 2,833,584 $ 1,374,0978.3¢ 59.1%1983-84 1,221,256 143 524,857 $ 4,842,400 $ 6,337,<strong>08</strong>3 $ 1,494,683 $ 1,452,4504.1¢ 76.4%1984-85 1,240,003 152 568,902 $ 5,410,502 $ 6,411,3<strong>08</strong> $ 1,000,806 $ 1,212,2612.5¢ 84.4%1985-86 1,394,320 167 597,025 $ 5,658,915 $ 6,424,634 $ 765,719 $ 1,097,9661.8¢ 88.1%1986-87 1,461,003 173 624,6<strong>18</strong> $ 6,072,523 $ 6,510,113 $ 437,590 $ 955,5091.0¢ 93.3%1987-88 (S5) 1,661,512 174 749,996 $ 8,223,462 $ 7,859,783 $ (363,679) $ 1,145,330(0.7¢) 104.6%1988-89 1,717,539 164 865,003 $ 11,458,<strong>08</strong>4 $ 10,563,459 $ (894,625) $ 794,159(1.2¢) 1<strong>08</strong>.5%1989-90 1,746,673 174 882,167 $ 12,<strong>18</strong>9,942 $ 11,8<strong>08</strong>,251 $ (381,691) $ 988,847(1.4¢) 103.2%1990-91 (S6) 1,791,781 159 946,988 $ 13,306,307 $ 13,364,150 $ 57,843 $ 1,170,448(0.7¢) 99.6%1991-92 1,673,107 161 884,224 $ 13,152,063 $ 13,245,924 $ 93,861 $ 1,012,564(0.5¢) 99.3%1992-93 (S7) 1,810,572 155 951,987 $ 13,692,612 $ 13,254,709 $ (437,903) $ 958,857(0.8¢) 103.3%1993-94 (S8) 1,699,882 133 876,766 $ 12,725,094 $ 14,017,591 $ 1,292,497 $ 1,525,074 $ 727,987 0.9¢ 90.8%1994-95 (S9) 1,464,577 119 790,781 $ 11,805,859 $ 16,061,849 $ 4,255,990 $ 3,642,588 $ 1,700,424 5.0¢ 73.5%1995-96 (S10) 1,480,674 125 912,905 $ 13,553,553 $ 23,983,026 $ 10,429,473 $ 11,107,071 $ 863,230 11.4¢ 56.5%1996-97 1,617,641 134.7 1,035,290 $ 14,804,355 $ 39,563,546 $ 24,759,191 $ 16,<strong>18</strong>9,103 $ 10,020,544 24.5¢ 37.4%1997-98 (S11) 1,624,693 120.4 1,069,547 $ 15,194,498 $ 44,769,723 $ 29,575,225 $ 20,369,417 $ 10,600,767 29.1¢ 33.9%1998-99 (S12) 1,563,275 101.9 1,047,394 $ 16,401,625 $ 40,391,845 $ 23,990,220 $ 22,078,192 $ 4,014,071 25.3¢ 40.6%1999-00 1,567,3<strong>18</strong> 99.3 1,050,103 $ 17,883,725 $ 37,497,489 $ 19,613,764 $ 20,806,672 $ 1,381,986 19.8¢ 47.7%2000-01 (S13) 1,661,704 106.2 1,113,342 $ 20,430,153 $ 38,215,732 $ 17,785,579 $ 21,911,398 $ 335,197 16.6¢ 53.5%2001-02 (S14) 1,742,768 1<strong>08</strong>.3 1,167,655 $ 20,922,453 $ 39,374,190 $ <strong>18</strong>,451,737 $ 21,976,<strong>18</strong>3 $ 502,<strong>08</strong>0 16.6¢ 53.1%2002-03 2,030,491 114.1 1,360,429 $ 22,247,564 $ 42,331,531 $ 20,<strong>08</strong>3,967 $ 23,901,407 $ 472,848 16.7¢ 52.6%2003-04 2,307,010 126.9 1,545,697 $ 24,559,<strong>18</strong>3 $ 45,300,782 $ 20,741,599 $ 21,719,288 $ 94,883 16.0¢ 54.2%2004-05 (S15) 2,454,396 129.8 1,644,445 $ 26,660,048 $ 48,105,899 $ 21,445,851 $ 21,445,85115.7¢ 55.4%2005-06 2,655,490 133.3 1,858,843 $ 31,604,715 $ 55,570,797 $ 23,966,<strong>08</strong>2 $ 23,966,<strong>08</strong>215.6¢ 56.9%TOTAL 47,786,792 25,979,431 $ 362,613,259 $ 616,372,903 $ 253,759,644 $ 249,368,723* Through September 1995, the <strong>State</strong> supported specific trains; Amtrak operated the remaining trains as basic system trains not receiving <strong>State</strong>funding. Between Oc<strong>to</strong>ber 1995 and Oc<strong>to</strong>ber 1997, the <strong>State</strong> supported 64 percent of the operation of all trainson the Pacific Surfliner Route; Amtraksupports 36 percent as basic system trains. Effective November 1997, <strong>State</strong> support increased <strong>to</strong> 67%. Effective December 2004, <strong>State</strong> supportincreased <strong>to</strong> 70%. <strong>State</strong> supports 100 percent of net cost of connecting buses; all data shown includes bus operations.(S1) Three round trips between Los Angeles and San Diego (LA-SD) (S8) Third <strong>State</strong>-supported LA-SB round trip added 2/1/94.(not <strong>State</strong>-supported) through 8/30/76.(S9) Ninth LA-SD round trip (<strong>State</strong>-supported in one direction only)(S2) Fourth LA-SD round trip (first <strong>State</strong>-supported train) added 9/1/76; discontinued 5/15/95.fifth LA-SD round trip (second <strong>State</strong>-supported train) added 4/24/77.(S10) Los Angeles-San Luis Obispo round trip added 10/29/95, also(S3) Sixth LA-SD round trip (third <strong>State</strong>-supported train) added 2/14/78.represents fourth LA-SB round trip.(S4) Seventh LA-SD round trip (not <strong>State</strong>-supported) added 10/26/80.(S11) Ninth LA-SD round trip res<strong>to</strong>red and tenth LA-SD round trip added(S5) Eighth LA-SD round trip (fourth <strong>State</strong>-supported train) added 10/26/97.10/25/87; first <strong>State</strong>-supported round trip between Los Angeles (S12) Eleventh LA-SD roundtrip added 10/25/98.and Santa Barbara (LA-SB) added 6/26/88. (S13) Twelfth LA-SD round trip on weekends only added on 5/21/01.(S6) Second <strong>State</strong>-supported LA-SB round trip added 10/28/90. (S14) Fifth LA-SB round trip on weekends only added on 5/25/02.(S7) Ninth LA-SD round trip (not <strong>State</strong>-supported) added 10/25/92. (S15) Second LA-SLO round trip added on 11/17/04.(F1) Passenger-miles per train mile (PM/TM), a measure of the average load on a train over its entire route. Actual passenger-mile data was not provided by Amtrak prior <strong>to</strong>August 1981. PM/TM figures shown for All Trains are calculated by Amtrak and cover the Amtrak Fiscal Year (Oc<strong>to</strong>ber through September).(F2) Prior <strong>to</strong> Oc<strong>to</strong>ber 1983, all trains billed on solely related cost basis. From Oc<strong>to</strong>ber 1983 through September 1995, all Los Angeles- San Diego trains and the first Los Angeles-Santa Barbara train billed on short-term avoidable cost basis. The second and third Los Angeles- Santa Barbara trains billed on long-term avoidable cost basis.Between Oc<strong>to</strong>ber 1995 and September 1996, all trains billed on long-term avoidable cost basis. Effective Oc<strong>to</strong>ber 1996, all trains billed on Full Cost (Train, Route and System)Basis. Depreciation and interest (equipment capital cost) included in operating cost under solely-related basis but excluded and charged separately under short-term, long-termavoidable and full cost bases.(F3) From Oc<strong>to</strong>ber 1976 through September 1983, <strong>State</strong> cost was 48.5 percent of operating loss (including equipment costs). For the third Los Angeles- Santa Barbara train, <strong>State</strong>cost was 100 percent of operating loss from February 1994 through September 1994, and 70 percent through September 1995. For all other trains, effective Oc<strong>to</strong>ber 1983,through September 1995, <strong>State</strong> cost was 65 percent of operating loss plus 50 percent of depreciation and interest (equipment capital cost). Between Oc<strong>to</strong>ber 1995 andSeptember 1996, <strong>State</strong> cost was 100 percent of operating loss and 60 percent of equipment capital cost for the <strong>State</strong> supported 64 percent of train service on the route.Between Oc<strong>to</strong>ber 1996 and September 1997, <strong>State</strong> cost was 55 percent of operating loss and 100 percent of equipment capital cost for the 64 percent <strong>State</strong> share. EffectiveOc<strong>to</strong>ber 1997, <strong>State</strong> is billed contractually specified percentages of most individual cost elements, plus a fixed amount for certain other cost elements. The <strong>State</strong> shareincreased <strong>to</strong> 67 percent in November 1997 and <strong>to</strong> 70 percent in December 2004 of train service on the route <strong>to</strong> reflect additional <strong>State</strong> supported service. Also includes <strong>State</strong>payment of special payments <strong>to</strong> Amtrak for additional service and <strong>State</strong> payment for entire net cost of all connecting bus routes.(F4) Between <strong>State</strong> Fiscal Years 1993-94 and 2003-04, Amtrak cost is based on billings submitted and reflects cost bases and Amtrak shares as stated in notes (F2) and (F3)above. However, Amtrak does not include the unbilled Amtrak share of fixed cost elements. Prior <strong>to</strong> FY 1993-94, data <strong>to</strong> calculate Amtrak cost is not available; beginning inFY 2004-05, no Amtrak share is billed.(F5) Train loss (deficit) per train passenger mile. Separate passenger-mile data for <strong>State</strong>-supported trains was not provided by Amtrak prior <strong>to</strong> August 1981. Connecting buses notincluded in loss per passenger mile data.(F6) Farebox Ratio, the ratio of Revenue <strong>to</strong> Expense.102
103Chapter VI – Pacific Surfliner Route