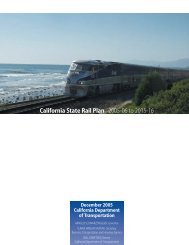
- Page 1:
California State Rail Plan 2007-08
- Page 4 and 5:
2007-08 - 2017-18 California State
- Page 7 and 8:
Table of ContentsTable of Contents(
- Page 9 and 10:
Table of ContentsTable of Contents(
- Page 11 and 12:
Table of ContentsTable of Contents(
- Page 13 and 14:
Table of FiguresTable of FiguresFig
- Page 15 and 16:
California State Rail Plan 2007-08
- Page 17 and 18:
CALIFORNIA TRANSPORTATION PLAN 2025
- Page 19 and 20:
during evenings and weekends.• Cr
- Page 21 and 22: ArcataFortunaScotia• Improved Amt
- Page 23 and 24: SouthernCaliforniaCommuterRailChapt
- Page 25 and 26: NorthernCaliforniaCommuterRail• C
- Page 27 and 28: AUBURN-OAKLAND REGIONAL RAIL SERVIC
- Page 29 and 30: AMTRAK PLANNINGIn April 2005, Amtra
- Page 31 and 32: it is in the strategic interest of
- Page 33 and 34: INTRODUCTIONGovernment Code Section
- Page 35 and 36: PART IPASSENGER RAIL ELEMENT3
- Page 37 and 38: Chapter I - California’s Vision f
- Page 39 and 40: Chapter I - California’s Vision f
- Page 41 and 42: Chapter I - California’s Vision f
- Page 43 and 44: Chapter I - California’s Vision f
- Page 45 and 46: Chapter I - California’s Vision f
- Page 47 and 48: Chapter I - California’s Vision f
- Page 49 and 50: Chapter II - Capital ProgramCHAPTER
- Page 51 and 52: Chapter II - Capital ProgramFigure
- Page 53 and 54: Chapter II - Capital ProgramFigure
- Page 55 and 56: Chapter II - Capital ProgramFigure
- Page 57 and 58: Chapter II - Capital Programevaluat
- Page 59 and 60: Chapter II - Capital Programsignals
- Page 61 and 62: Chapter II - Capital ProgramThe Dep
- Page 63 and 64: Chapter II - Capital ProgramIn the
- Page 65 and 66: Chapter II - Capital ProgramFigure
- Page 67 and 68: Chapter II - Capital Programsupplem
- Page 69 and 70: Chapter II - Capital ProgramA numbe
- Page 71: Chapter III - Operations ProgramCHA
- Page 75 and 76: Chapter III - Operations ProgramFig
- Page 77 and 78: Chapter III - Operations ProgramFig
- Page 79 and 80: Chapter III - Operations ProgramADM
- Page 81 and 82: Chapter III - Operations Programcon
- Page 83 and 84: Chapter III - Operations ProgramSta
- Page 85 and 86: Chapter III - Operations Programres
- Page 87 and 88: Chapter III - Operations ProgramFig
- Page 89 and 90: Chapter III - Operations ProgramPro
- Page 91 and 92: Chapter III - Operations ProgramFig
- Page 93 and 94: Chapter III - Operations Program•
- Page 95 and 96: Chapter III - Operations ProgramFig
- Page 97 and 98: Chapter III - Operations ProgramFig
- Page 99 and 100: Chapter IV - Marketing ProgramCHAPT
- Page 101 and 102: Chapter IV - Marketing Programprodu
- Page 103 and 104: Chapter IV - Marketing ProgramGROUP
- Page 105 and 106: Chapter IV - Marketing ProgramThe f
- Page 107 and 108: Chapter IV - Marketing ProgramBEYON
- Page 109 and 110: Chapter V - The California Passenge
- Page 111 and 112: Chapter V - The California Passenge
- Page 113 and 114: Chapter V - The California Passenge
- Page 115 and 116: Chapter V - The California Passenge
- Page 117 and 118: Chapter V - The California Passenge
- Page 119 and 120: Chapter V - The California Passenge
- Page 121 and 122: Chapter V - The California Passenge
- Page 123 and 124:
Chapter VI - Pacific Surfliner Rout
- Page 125 and 126:
Chapter VI - Pacific Surfliner Rout
- Page 127 and 128:
Chapter VI - Pacific Surfliner Rout
- Page 129 and 130:
Chapter VI - Pacific Surfliner Rout
- Page 132 and 133:
2007-08 - 2017-18 California State
- Page 134 and 135:
2007-08 - 2017-18 California State
- Page 136 and 137:
2007-08 - 2017-18 California State
- Page 138 and 139:
2007-08 - 2017-18 California State
- Page 140 and 141:
2007-08 - 2017-18 California State
- Page 142 and 143:
2007-08 - 2017-18 California State
- Page 144 and 145:
2007-08 - 2017-18 California State
- Page 146 and 147:
2007-08 - 2017-18 California State
- Page 148 and 149:
2007-08 - 2017-18 California State
- Page 150 and 151:
2007-08 - 2017-18 California State
- Page 152 and 153:
2007-08 - 2017-18 California State
- Page 154 and 155:
2007-08 - 2017-18 California State
- Page 156 and 157:
2007-08 - 2017-18 California State
- Page 158 and 159:
2007-08 - 2017-18 California State
- Page 160 and 161:
2007-08 - 2017-18 California State
- Page 162 and 163:
2007-08 - 2017-18 California State
- Page 164 and 165:
2007-08 - 2017-18 California State
- Page 166 and 167:
2007-08 - 2017-18 California State
- Page 168 and 169:
2007-08 - 2017-18 California State
- Page 170 and 171:
2007-08 - 2017-18 California State
- Page 172 and 173:
2007-08 - 2017-18 California State
- Page 174 and 175:
2007-08 - 2017-18 California State
- Page 176 and 177:
2007-08 - 2017-18 California State
- Page 178 and 179:
2007-08 - 2017-18 California State
- Page 180 and 181:
2007-08 - 2017-18 California State
- Page 182 and 183:
2007-08 - 2017-18 California State
- Page 184 and 185:
2007-08 - 2017-18 California State
- Page 186 and 187:
2007-08 - 2017-18 California State
- Page 188 and 189:
2007-08 - 2017-18 California State
- Page 190 and 191:
2007-08 - 2017-18 California State
- Page 192 and 193:
2007-08 - 2017-18 California State
- Page 194 and 195:
2007-08 - 2017-18 California State
- Page 196 and 197:
2007-08 - 2017-18 California State
- Page 198 and 199:
2007-08 - 2017-18 California State
- Page 200 and 201:
2007-08 - 2017-18 California State
- Page 202 and 203:
2007-08 - 2017-18 California State
- Page 204 and 205:
2007-08 - 2017-18 California State
- Page 206 and 207:
2007-08 - 2017-18 California State
- Page 208 and 209:
2007-08 - 2017-18 California State
- Page 210 and 211:
2007-08 - 2017-18 California State
- Page 212 and 213:
2007-08 - 2017-18 California State
- Page 214 and 215:
2007-08 - 2017-18 California State
- Page 216 and 217:
2007-08 - 2017-18 California State
- Page 218 and 219:
2007-08 - 2017-18 California State
- Page 220 and 221:
2007-08 - 2017-18 California State
- Page 222 and 223:
2007-08 - 2017-18 California State
- Page 224 and 225:
2007-08 - 2017-18 California State
- Page 226 and 227:
2007-08 - 2017-18 California State
- Page 228 and 229:
2007-08 - 2017-18 California State
- Page 230 and 231:
2007-08 - 2017-18 California State
- Page 232 and 233:
2007-08 - 2017-18 California State
- Page 234 and 235:
2007-08 - 2017-18 California State
- Page 236 and 237:
2007-08 - 2017-18 California State
- Page 238 and 239:
2007-08 - 2017-18 California State
- Page 240 and 241:
2007-08 - 2017-18 California State
- Page 242 and 243:
2007-08 - 2017-18 California State
- Page 244 and 245:
2007-08 - 2017-18 California State
- Page 246 and 247:
2007-08 - 2017-18 California State
- Page 248 and 249:
2007-08 - 2017-18 California State
- Page 250 and 251:
2007-08 - 2017-18 California State
- Page 252 and 253:
2007-08 - 2017-18 California State
- Page 254 and 255:
2007-08 - 2017-18 California State
- Page 256 and 257:
2007-08 - 2017-18 California State
- Page 258 and 259:
2007-08 - 2017-18 California State
- Page 260 and 261:
2007-08 - 2017-18 California State
- Page 262 and 263:
2007-08 - 2017-18 California State
- Page 264 and 265:
2007-08 - 2017-18 California State
- Page 266 and 267:
2007-08 - 2017-18 California State
- Page 268 and 269:
2007-08 - 2017-18 California State
- Page 270 and 271:
2007-08 - 2017-18 California State
- Page 272 and 273:
2007-08 - 2017-18 California State
- Page 274 and 275:
2007-08 - 2017-18 California State
- Page 276 and 277:
2007-08 - 2017-18 California State
- Page 278 and 279:
2007-08 - 2017-18 California State
- Page 280 and 281:
2007-08 - 2017-18 California State
- Page 282 and 283:
2007-08 - 2017-18 California State
- Page 284 and 285:
2007-08 - 2017-18 California State
- Page 286 and 287:
2007-08 - 2017-18 California State
- Page 288 and 289:
2007-08 - 2017-18 California State
- Page 290 and 291:
2007-08 - 2017-18 California State
- Page 292 and 293:
2007-08 - 2017-18 California State
- Page 294 and 295:
2007-08 - 2017-18 California State
- Page 296 and 297:
2007-08 - 2017-18 California State
- Page 298 and 299:
2007-08 - 2017-18 California State
- Page 300:
2007-08 - 2017-18 California State